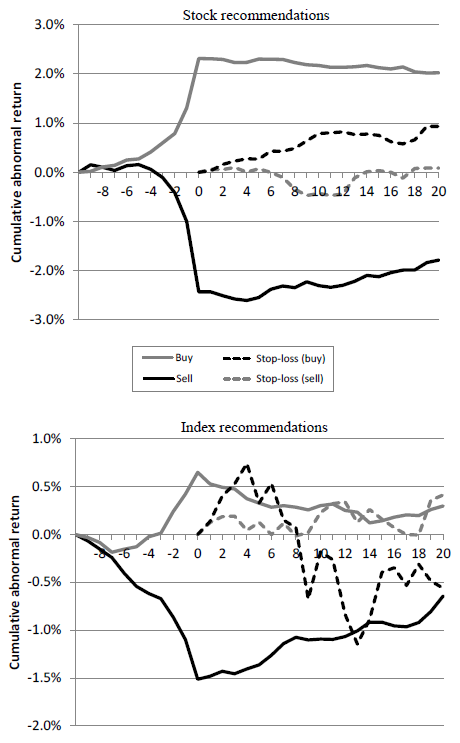
Do equity trade recommendations from technical analysis experts beat the market? In his February 2016 paper entitled “Are Chartists Artists? The Determinants and Profitability of Recommendations Based on Technical Analysis”, Dirk Gerritsen evaluates technically based buy and sell recommendations for individual Dutch stocks and the AEX index. Specifically, he measures abnormal performance from 10 trading days before (including the publication date) through 20 trading days after recommendations. For individual stocks, “abnormal” means in excess of the return estimated by the four-factor (market, size, book-to-market, momentum) model. For the AEX index, abnormal means in excess of average index return over the year preceding the 30-day measurement interval. For recommendations that include stop-loss instructions, he measures also abnormal asset performance after any stop-loss actions. Finally, he examines whether recommendations agree with the consensus of eight kinds of simple technical trading rules. Using daily stock and and AEX index prices, total returns and trading volumes associated with 5,017 recommendations (3,967 with 500 stop-losses for individual stocks and 1,050 with 242 stop-losses for the index) from 101 experts on the Dutch stock market during 2004 through 2010, he finds that:
- For stocks (the index), about 68% (58%) of recommendations are buys, varying positively with contemporaneous market performance.
- Average recommended stop-loss levels relative to price at publication are:
- 8.4% lower (8.6% higher) for recommended stock buys (sells).
- 2.5% lower (2.6% higher) for recommended index buys (sells).
- For the trade performance measurement interval (see the charts below):
- During the 10 trading days before stock and index buy (sell) recommendations, average cumulative abnormal returns are positive (negative). Recommended directions thus generally agree with those of aggregated simple technical trading rules.
- During the 20 trading days after recommendations, preceding trends tend weakly to reverse, resulting in modest losses for both buys and sells.
- Returns during the 20-trading days after triggering of stop-losses reveal little or no value for this approach to risk mitigation.
- Results are similar for subsamples of:
- Recommendations from individual analysts.
- Recommendations from corporate groups.
- “Artistic” recommendations (those not agreeing with simple technical trading rules).
The following charts, taken from the paper, summarize average cumulative abnormal returns from 10 trading days before through 20 trading days after publication of individual stock (upper chart) and AEX index (lower chart) buy and sell recommendations over the sample period. They also show the cumulative abnormal returns of stocks and the index over the 20 trading days after triggering of stop-losses when specified. Results show that, on average:
- Recommendations tend to follow recent trends.
- After recommendations, trends reverse and produce modest trade losses.
- Stop-losses are modestly harmful for stock buys, useless for stock sells, initially harmful but later helpful for index buys and perhaps slightly helpful for index sells.

In summary, evidence indicates that the recommendations of Dutch equity technical analysts are on average somewhat harmful to traders following them.
Cautions regarding findings include:
- As emphasized in the paper, findings are for the Dutch stock market only. Results in other markets and for other asset classes may differ.
- Return measurements are gross, not net. Accounting for trading frictions and shorting costs would reduce trade performance, amplifying findings.