What should investors expect to see in a typical investment advisor’s model portfolio? In their July 2019 paper entitled “Factors and Advisors Portfolios”, Brian Lawler, Andrew Ang, Brett Mossman and Patrick Nolan examine patterns and factor exposures in detailed holdings for a large number of model portfolios from many types of investment advisors. When holdings are funds, they examine contents of the funds. They assess exposures to economic growth, real interest rates and inflation. Within equity holdings, they assess exposures to size, value, momentum, quality and volatility factors. Using holdings of 9,940 model portfolios provided by investment advisors during October 2017 through September 2018, they find that:
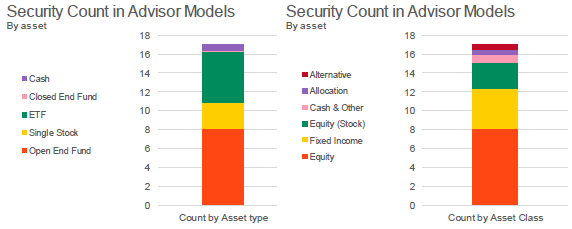
- On average, portfolios contain 17 direct holdings (see the charts below):
- Mutual funds and exchange-traded funds (ETF), dominate, with eight equities and four fixed income.
- 73% of portfolios have at least 50% exposure to equities.
- Average annual fee is 0.54%, ranging from 0.14% at the 5th percentile to 0.96% at the 95th percentile. In general, portfolio fees decline with the number of ETFs held.
- Portfolios are heavily exposed to economic growth through equities and are thus not robust to economic downturns.
- Within equities, the only significant overall style tilt is small size, obtained substantially from fund allocations. Advisors not understanding holdings of these funds in detail may underestimate size exposure of their portfolios.
- Within fixed income, portfolios veer towards short duration and high credit risk.
- Portfolios exhibit significant home bias (relative to mean-variance optimization). Within equities (fixed income), the share of non-U.S. assets is 28.7% (13.9%), compared to 46.2% (61.1%) in global indexes.
- Correlations between fees and absolute risk, active risk and number of positions are insignificant, implying that investors can generally find similar portfolios at lower prices.
The following charts, taken from the paper, summarize average contents of advisor model portfolios by type of holding and by asset class. The typical portfolio has 17 assets, concentrated among mutual (open end) funds and ETFs. Average allocation to equities is about 55%.

In summary, evidence indicates that the typical investment advisors rely heavily on funds and exploit just a few factors.
Cautions regarding findings include:
- As noted in the paper, advisors willing to share their model portfolios may not be representative of all advisors.
- Since the sample is a snapshot, holdings may reflect current tactical positions rather than long-term beliefs and exposures.
- As noted in the paper, advisors have other considerations in devising models, such as taxes.
- The authors may overstate the ease with which advisors can efficiently introduce other significant factor exposures.