What are asset class return expectations and associated portfolio allocations of very sophisticated U.S. investors? In their February 2019 paper entitled “The Return Expectations of Institutional Investors”, Aleksandar Andonov and Joshua Rauh analyze disclosures of expected returns across asset classes among U.S. public pension funds, which hold assets of about $4 trillion (see the first chart below), including fixed income, cash, equities, real assets, hedge funds, private equity and other asset classes. Taking into account past fund performance, they investigate how fund managers estimate future returns. Disclosures also reveal target allocations to asset classes (see the second chart below). Together, expected asset class returns and target allocations allow calculation of expected portfolio returns. Using annual disclosures for 228 U.S. state and local government pension plans during 2014 through 2017, they find that:
- Past performance strongly influences return expectations, with 1% higher last-year portfolio return typically raising expected portfolio return 0.25%. Strength of past return influence increases with fund manager tenure and concentrates among certain investment consultants.
- Higher past return also tends to increase risk-taking, with 1% higher past 10-year portfolio return indicating 2% higher target allocations to risky assets overall.
- However, portfolio performance in a given year is, in fact, not significantly related to performance over the previous 10 years.
- Pension funds with higher unfunded liabilities assume higher returns, but through higher inflation, not higher real returns.
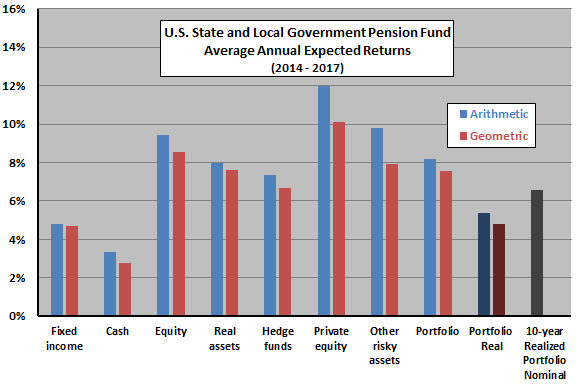
The following chart, constructed from data in the paper, summarizes average annual expected nominal returns by asset class for U.S. state and local government pension funds during 2014-2017, separately for funds reporting arithmetic or geometric average returns. The chart also shows for reference expected nominal and real returns at the portfolio level, and realized fund average nominal return for all funds over the past 10 years.

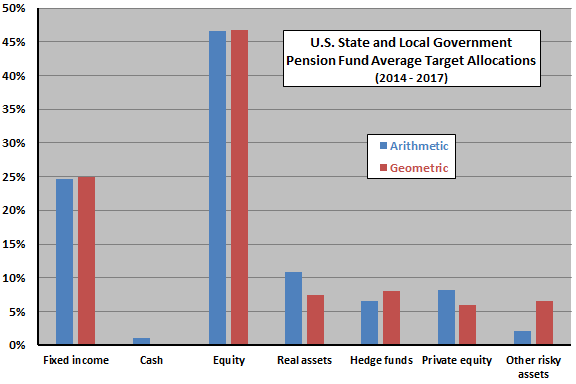
The next chart, also constructed from data in the paper, summarizes average asset class target allocations for U.S. state and local government pension funds during 2014-2017, again separately for funds reporting arithmetic or geometric returns.

In summary, evidence indicates that sophisticated pension fund managers allocate about 70% of assets to stocks and bonds (with 65-35 ratio), and that they believe in portfolio performance persistence.
Cautions regarding findings include:
- The sample period is very short in terms of variety of market conditions, containing no equity bear markets.
- As noted in the paper, the sample is too short to assess long-term performance persistence.
See also “How Large University Endowments Allocate Investments” and “University Endowment Performance: Strategic versus Tactical Allocation”.