Do active investment managers beat the market? In their January 2014 paper entitled “Active Manager Performance: Alpha and Persistence”, Frank Benham and Edmund Walsh assess the performance of active investment managers relative to appropriate benchmarks across asset classes over long periods. They consider six basic investment classes: core bonds; high-yield bonds; domestic large capitalization stocks; domestic small capitalization stocks; foreign large capitalization stocks; and, emerging markets stocks. They focus on whether investment managers beat benchmarks in the past and whether past outperformers become future outperformers. They take steps to avoid survivorship bias, selection bias and fund classification errors. Using a sample of 5,379 live and dead funds assembled from Morningstar Direct by filtering to avoid classification errors and to eliminate redundant funds run by the same manager from benchmark inceptions (ranging from January 1979 for domestic stocks to January 1988 for emerging markets stocks) through 2012, they find that:
- On a gross basis over available sample periods, median managers outperform appropriate benchmarks for four of six asset classes, but outpeformance is marginal for two classes.
- Gross annualized outperformance is material (about 0.9% per year) only for domestic small capitalization stocks and emerging markets stocks.
- Within the domestic small capitalization class, the median value (growth) manager outperforms an appropriate benchmark by a gross annualized 1.2% (0.8%).
- Even for very large accounts, median fees are at least as large as as gross median outperformance. In other words, on a net basis, typical investment managers underperform appropriate benchmarks.
- The gap in gross annualized returns between the top and bottom fourths (quartiles) of managers is in the range 2.8%-3.4% for equity classes, about 1.7% for high-yield bonds and 0.6% for core bonds.
- Subperiods of domestic equity manager outperformance tend to occur during bear markets.
- Consistent with increasing competition, gross annualized performance relative to appropriate benchmarks declines from pre-2003 to 2003-2012 subperiods by amounts ranging from -0.5% (core bonds) to -4.1% (domestic small capitalization stocks). Also, the difference in performance between top and bottom quartiles shrinks.
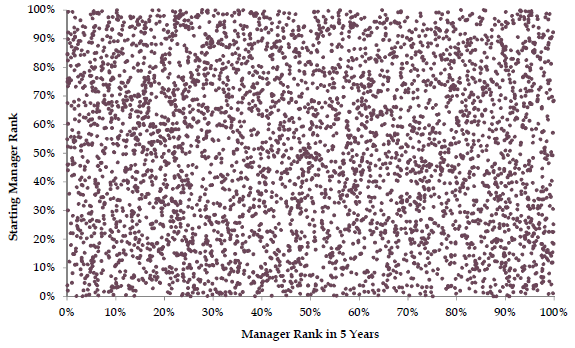
- The relationship between manager performance over the past five years and the same manager’s performance over the next five years is close to random (see the chart below). Moreover, managers in both the top and bottom tenths of performance over the past five years have average ranks near 50% over the next five years.
The following scatter plot, taken from the paper, relates ranks of individual active investment managers in the domestic large capitalization stocks class over the last five years to their ranks over the next five years during the available sample period. There is no evident pattern. A managers who outperforms over the last five years is no more likely to outperform over the next five years than a manager selected at random. In other words, past performance is not a good predictor of future performance.

In summary, evidence does not support belief that the typical active investment manager outperforms an appropriate passive investment. Rather, on a net basis, the converse appears more likely.
Cautions regarding findings include:
- As noted, returns reported in the paper are generally gross, not net, with total frictions generally exceeding any gross outperformance of benchmarks.
- Use of different start dates for different asset classes may mislead when comparing investment manager performance across classes (the sample for a class may start with a strong bull or bear market).
- As noted by the authors, controlling for factors such as macroeconomic timing, style, sector/industry concentration and overall active risk may identify managers who possess skill.