Have long-short alternative beta (style premium) strategies worked well in practice? In their February 2019 paper entitled “A Decade of Alternative Beta”, Antti Suhonen and Matthias Lennkh use actual performance data to assess alternative beta strategies across asset classes from the end of 2007 through the end of 2017, including quantification of fees and potential survivorship bias in public data. Specifically, they form three equal volatility weighted (risk parity) composite portfolios of strategies at the ends of each year during 2007-2016, 2007-2011 and 2012-2016. Each portfolio includes all the strategies launched during the first year and then adds strategies launched each following year at the end of that year. When a strategy dies (is discontinued by the offeror), they reallocate its weight to surviving strategies within the portfolio. They also create two additional portfolios for each period/subperiod that segregate equities and non-equities. They further evaluate alternative beta strategy diversification benefits by comparing them to conventional asset class portfolios. Using weekly post-launch excess returns in U.S. dollars for 349 reasonably unique live and dead alternative beta strategies offered by 17 global investment banks, spanning 14 styles and having at least one year of history during 2008 through 2017, they find that:
- The full-sample composite portfolio generates 0.80% average annual gross excess return, with 0.91% annual volatility and 0.88 gross annual Sharpe ratio (see the chart below). Returns exhibit modestly negative skewness (extended left tail) and modestly high kurtosis (fat tails). About 22% of strategies die during the sample period.
- The composite subset of equity (non-equity) strategies performs substantially worse than (about the same as) the full sample, with average annual gross excess return 0.62% (0.76%) and Sharpe ratio 0.21 (0.89). The equity subset has notably fat tails (drawdown risk).
- The full-sample, equity and non-equity composite portfolios have maximum drawdowns -29%, -30% and -28%, respectively, all three during May 2011 to January 2013.
- Performances of composite portfolios of recent vintage strategies are stronger than those for the full sample, especially for the equities subset, perhaps due to different mixes of styles.
- After adjusting for exposures to conventional equity and bond benchmarks and accounting for fees not included in reported returns, the full-sample composite alternative beta portfolio has little to offer.
- Investable equity and bond market benchmarks explain about two thirds of gross alternative beta performance.
- Annual fees not included in returns are in the range 0.75% to 1% in early sample years, 0.5%-0.75% by 2012 and 0%-0.5% in the last few years.
- An allocation to alternative beta brings some diversification benefits to a traditional 60%-40% stocks-bonds portfolio, but results are very sensitive to assumed fees.
- Publicly available alternative beta performance data that do not account for dead strategies overstate returns by 7%-14% for multi-asset strategies and up to 37% for equity-only strategies.
- There is no obvious relationship between strategy age and likelihood of death.
- The most complex strategies die at twice the rate of simpler ones, suggesting greater overfitting.
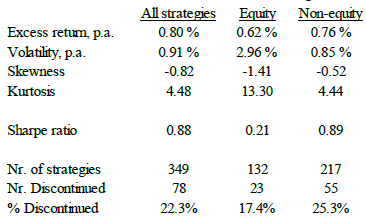
The following table, excerpted from the paper, summarizes average annual gross excess return, annual volatility (standard deviation of annual excess returns), return skewness, return kurtosis, gross annual Sharpe ratio, size of universe (Nr. of strategies) and number of funds that die (Nr. Discontinued) for each of three equal volatility weighted composite alternative beta strategy portfolios during 2008-2017. Equity and non-equity subsets include only strategies focused on stocks (all other strategies). The table shows that:
- Returns are low.
- Volatilities are low.
- Sharpe ratios are good overall and for non-equity, but not for equity-only.
- There is moderate attrition of strategies.
As noted above, accounting for unincluded fees would materially lower performances.

In summary, evidence indicates that live net performance of alternative beta strategies (especially equity-only) during 2008-2017 is not very attractive.
Cautions regarding findings include:
- The 10-year sample period is short for assessment of investment strategies. It could be an unlucky (or a lucky) sample.
- As noted, performance data in the paper are gross, not net.
- Obtaining strong returns from these alternative beta strategies generally requires substantial leverage, which likely costs more than the risk-free rate used to calculate Sharpe ratio.
- As noted in the paper, investors generally cannot hold enough alternative beta strategies to achieve reported results reliably. Small groups of strategies would likely perform better or worse than the full sample. Strategies as tested are generally unavailable to retail investors.