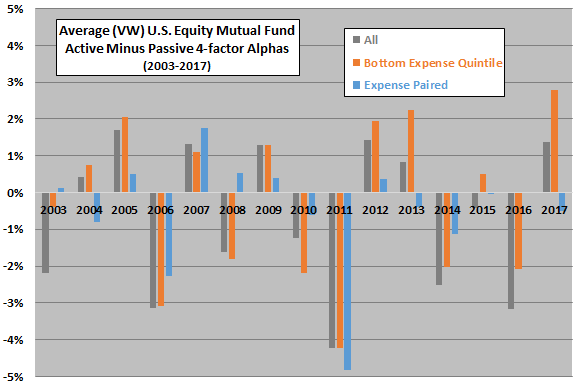
Do active U.S. equity mutual funds beat their passive counterparts in recent years? In the September 2018 version of his paper entitled “The Historical Record on Active vs. Passive Mutual Fund Performance”, David Nanigian compares risk-adjusted annual performance of active versus passive U.S. equity mutual funds as categorized and monitored in the Morningstar Direct survivorship bias-free database. He measures rise-adjusted performance based on the Carhart 4-factor model (accounting for market, size, book-to-market and momentum factors) alpha. He considers both value-weighted (VW), based on fund assets under management at the end of the prior month, and equal-weighted (EW) combinations of funds. In addition to the full sample, he considers separately funds in the bottom fifth (quintile) of expense ratios. He also compares active and passive funds paired based on similar expense ratios. Using monthly fund data as specified during 2003 through 2017, he finds that:
- For the full sample overall:
- Both active and passive funds generate significantly negative average annual alphas, whether VW (-0.38% and -1.00%, respectively) or EW (-0.69% and -1.34%, respectively).
- While passive funds outperform active funds, differences are not statistically strong.
- For the full sample, year-by-year (see the first chart below):
- VW (EW) active funds beat passive funds in 7 (5) of 15 years.
- There is no trend in the performance difference between active and passive funds.
- The preponderance of dollars invested in passive funds are in the bottom quintile of expense ratios. For the bottom expense quintile overall:
- Both active and passive funds generate significantly negative average annual alphas, whether VW (-0.37% and -0.59%, respectively) or EW (-0.45% and -0.71%, respectively).
- While passive funds outperform active funds, differences are much smaller and statistically weaker than for the full sample.
- For the bottom expense quintile, year-by-year:
- VW (EW) active funds beat passive funds in 8 (5) of 15 years.
- There is again no trend in the performance difference between active and passive funds.
- For passive and active funds paired by similar expense ratio overall:
- Both active and passive funds generate significantly negative average annual alphas, whether VW (-0.38% and -0.34%, respectively) or EW (-0.67% and -0.79%, respectively).
- For VW, active funds slightly outperform passive funds. For EW, passive funds still modestly outperform active funds.
- For passive and active funds paired by similar expense ratio, year-by-year:
- VW (EW) active funds beat passive funds in 7 (8) of 15 years.
- There is again no trend in the performance difference between active and passive funds.
The following chart, constructed from data in the paper, summarizes average VW differences in 4-factor alphas between active and passive U.S. equity mutual funds for three samples: (1) the full sample (All); (2) funds in the lowest expense ratio quintile (Bottom Expense Quintile); and, (3) funds with similar expense ratios (Expense Paired). Results indicate that:
- Sometimes passive wins and sometimes active wins.
- There is no trend in relative performances of active and passive funds over the sample period.

The next chart, also constructed from data in the paper, compares overall VW and EW active minus passive 4-factor alphas for: (1) the full sample (All); (2) funds in the lowest expense ratio quintile (Bottom Expense Quintile); and, (3) funds with similar expense ratios (Expense Paired). Results indicate that expenses play an important role in fund performance and, when expense ratios are similar, active and passive funds perform similarly.

In summary, evidence indicates that, when expense ratios are similar, there is hardly any difference in performance between passive and active U.S. equity mutual funds.
Cautions regarding findings include:
- The designation of active or passive is binary. Some active funds may be more active than others. For example, active funds with very low expense ratios may be much less active than those with high expense ratios.
- 4-factor alpha may not be the best way to measure fund performance for many investors.
- Though not the point of the study, factor alphas are gross, ignoring the costs of factor portfolio turnover. They therefore overstate factor values and represent practically unachievable benchmarks.
- Using different approaches to analyzing the same stochastic sample introduces data snooping bias, such that the most favorable findings overstate expectations.