A reader asked: “The American Association of Individual Investors (AAII) has a lot of strategies they have been paper-trading over many years at Stock Screens. It seems like every strategy builds upon a well-known investing book or otherwise publicized strategy from the last 40 years. Have you ever done an evaluation of those performance results?” According to AAII: “These approaches run the full spectrum, from those that are value-based to those that focus primarily on growth. Some approaches are geared toward large-company stocks, while others uncover micro-sized firms. Most fall somewhere in the middle.” AAII provides performance histories, risk-return statistics and characteristics for all screens. AAII cautions that: “The impact of factors such as commissions, bid-ask spreads, cash dividends, time-slippage (time between the initial decision to buy a stock and the actual purchase) and taxes is not considered. This overstates the reported performance…” Using monthly returns and turnovers for the equally weighted portfolios generated by the 60 screens presented during January 1998 through March 2018 (243 months), along with contemporaneous returns for SPDR S&P 500 (SPY), Vanguard Small Cap Index Fund (NAESX) and Vanguard Total Stock Market Index Fund (VTSMX), we find that:
Since many of the screens generate high monthly turnover of holdings and all involve monthly rebalancing to equal weights, trading frictions (transaction fees plus bid-ask spread) materially reduce gross returns. Also, screens that generate a relatively large number of holdings exacerbate the impact of transaction fees because a typical individual investor can afford only small positions in each, making transaction fees a noticeable percentage of transactions. Further, screens that focus on small or micro capitalization stocks tend to involve high trading frictions, because bid-ask spreads generally increase as a percentage of stock price as firm capitalization decreases.
For analysis of screen performance, we make the following assumptions:
- Regarding trading frictions:
- Trading frictions for each monthly adjustment specified by a screen (sell one stock and buy another) are 0.5% (0.25% per stock). This assumption may be harsh (generous) for screens that pick just a few relatively liquid stocks (many small stocks). Actual frictions depend on bid-ask spreads, broker fees and position sizes.
- Monthly screen turnover is the average monthly turnover reported by AAII. Actual monthly turnover may vary considerably from month to month and would be higher than reported after accounting for monthly rebalancing to equal weights.
- For example, if average monthly turnover for a screen is 50%, monthly trading friction for that portfolio is 50% times 0.5%, or 0.25%. High-turnover screens suffer higher trading frictions than low-turnover screens. Average monthly turnovers range from 8% to 93% across 60 screens, with average of averages 41%.
- Ignore dividends for lack of information. Some strategies involve stocks paying material dividends, and others do not. Portfolio turnover could disrupt qualification for dividends.
- Ignore tax implications of portfolio turnover. Many of the screens generate predominantly short-term capital gains/losses.
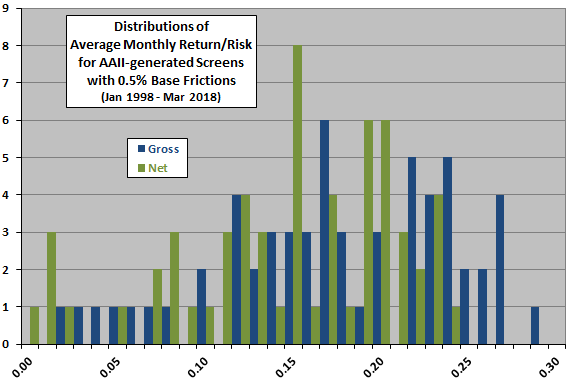
The following chart compares distributions of monthly return-risk ratios (average monthly return divided by standard deviation of monthly returns) for the 60 screens over the available sample period, before (gross) and after (net) accounting for estimated trading frictions. Notable points are:
- Incorporation of trading frictions shifts the distribution to the left and lengthens the left tail. Some of the highest-performing screens have high average monthly turnovers.
- Average gross (net) monthly return-risk ratio for all 60 screens is 0.18 (0.15).
- For comparison, monthly return-risk ratios for buying and holding SPY, NAESX and VTSMX over the same period are 0.15, 0.15 and 0.16, respectively. These benchmarks include dividends and may have an advantage over screens that pick dividend-paying stocks. However, they also greatly limit tax obligations.
- It is plausible that aggregate screen performance implied by the distributions is a result of data snooping bias. Many poorly performing screens may have been “swept under the rug” in the processes of: (1) developing each of these screens; and, (2) selecting this set of screens.
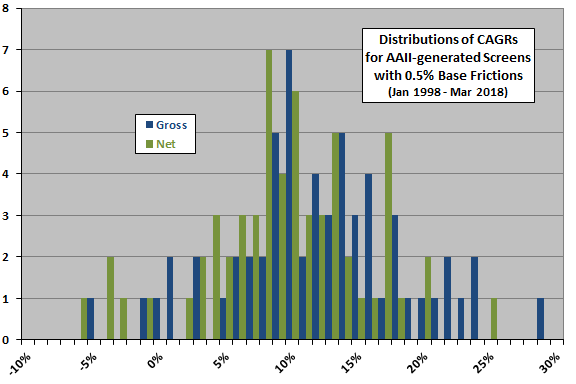
For another perspective, we look at distributions of gross and net compound average growth rates (CAGR).
The next chart compares CAGRs for the 60 screens over the available sample period, before (gross) and after (net) accounting for trading frictions. Again, incorporation of trading frictions shifts the distribution to the left. Average gross (net) CAGR for all 60 screens is 12.1% (9.4%). For comparison, CAGRs for buying and holding SPY, NAESX and VTSMX over the same period are 7.0%, 8.5% and 7.3%, respectively.
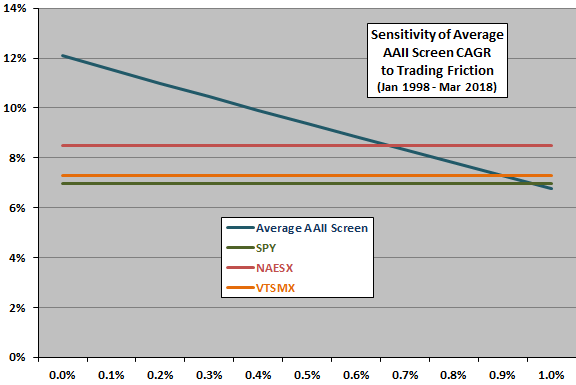
How sensitive is average screen performance to assumed level of trading frictions?
The next chart summarizes variation of average (equally weighted) CAGR for all 60 screens with level of trading frictions. Included as benchmarks are CAGRs for buying and holding SPY, NAESX and VTSMX over the same period. Results suggest that the typical active strategy involving individual stocks beats holding a broad market index as long as two-way (sell and buy) trading frictions are below roughly 0.6%.
Do active screens exhibit stable market-adjusted performance over time?
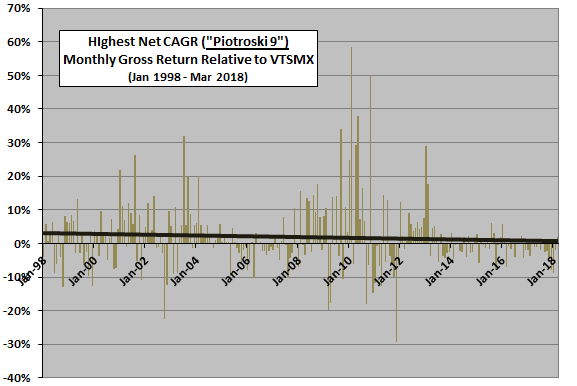
The next chart tracks monthly market-adjusted gross returns over the available sample period for “Piotroski 9,” the screen with the highest net CAGR (25.4%) for baseline 0.5% trading frictions. Market-adjusted means subtracting same-month VTSMX return from gross return for the screen.
The chart includes a best-fit linear trend line as a rough measure of the trend in monthly market outperformance over the sample period. The trend line slopes downward, indicating that gross outperformance weakens over the sample period, perhaps due to loss of luck from data snooping bias during strategy discovery or subsequent market adaptation (elevated competition for strategy returns). However, subperiods of outperformance and underperformance appear to cluster, and the sample period is not long in terms of number of bull and bear market states.
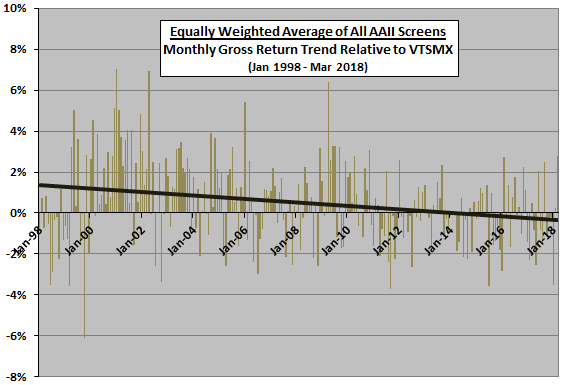
What about the trend in average screen performance?
The final chart tracks monthly market-adjusted returns over the available sample period for the equally weighted average gross return of all 60 screens. Market-adjusted again means subtracting same-month VTSMX return from the average gross return for the screens. The trend line indicates that, on average, gross screen outperformance deteriorates markedly to underperformance over time, with relative performance during the 2000-2002 bear market very influential. Again, loss of luck from old data snooping bias and subsequent market adaptation to strategies are possible explanations for the downtrend.
In summary, evidence from AAII Stock Screen performance data indicates that investors should consider the impact of portfolio turnover (trading frictions) and potential data snooping bias/market adaptation when evaluating stock screen backtests.
Cautions regarding findings include:
- The above approach to accounting for trading frictions is crude. More exact estimates may produce different results.
- AAII’s assumption of equal weighting for all screens, tending to generate many small trades each month, is especially problematic for investors with modest capital.
- Data acquisition and analysis burdens may not allow portfolio reformation as quickly as assumed by the AAII screens. Delays in execution may affect results.
- As noted, dividends may be material for some strategies, but AAII assumptions exclude them. The benchmark funds include dividends.
- Assessing the impact of data snooping bias is difficult. The number of screens tried and rejected in prior research is unknown. The number of screens considered and rejected by AAII is unknown (some screens appear and disappear over time). The overlap of the AAII test period and the backtest period involved in selecting each screen is unknown.
- As noted, the AAII screens would generate substantial short-term gains and losses in taxable accounts.