As summarized in “Twisting Buffett’s Preferred Stocks-bonds Allocation”: (1) Warren Buffett’s preferred fixed asset allocation of 90% stocks and 10% short‐term government bonds (90-10), rebalanced annually, is sensible for U.S. markets; and, (2) investors may be able to beat this allocation modestly by adding simple annual dynamics. Are findings similar internationally? In his July 2016 paper entitled “Global Asset Allocation in Retirement: Buffett’s Advice and a Simple Twist”, Javier Estrada extends his analysis of U.S. markets to 20 other countries. He assumes a 1,000 (local currency unit) nest egg to start a 30‐year retirement. Annual withdrawals (either 4% or 3% of the initial amount, adjusted annually for inflation) and rebalancing to the target allocation occur at the beginning of each year. The first 30‐year retirement interval is 1900‐1929 and the last 1985‐2014, for a total of 86 rolling intervals. He first compares performances of eight fixed stocks-bonds allocations, rebalanced annually, ranging from 100-0 to 30-70. He then compares a fixed 90-10 allocation to one with a dynamic twist that, at the end of each year, compares the stock market’s annualized total return over the last five years to its annualized total return since the beginning of the sample. If 5-year performance exceeds long-term performance, the annual withdrawal comes from stocks with rebalancing to 90-10. If long-term performance exceeds 5-year performance, the annual withdrawal comes from bonds with no portfolio rebalancing (giving stocks time to recover). He focuses on average portfolio failure rate (running out of money within 30 years) and average terminal wealth across countries as key performance metrics. Using annual stock and short-term government bond real total returns (adjusted by local inflation rate) in local currencies for 21 countries as compiled by Dimson‐Marsh‐Staunton for 1900 through 2014, he finds that:
- Across fixed allocations (see the first table below);
- Average failure rate increases systematically as stock allocation decreases.
- Standard deviation of annual returns decreases systematically as stock allocation decreases, but volatility may be upside.
- Terminal wealth decreases systematically with stock allocation for almost all metrics (mean, median and 5th, 10th, 25th, 75th, 90th and 95th percentiles). An exception is that 90-10 slightly outperforms 100-0 at the 5th percentile (the worst outcomes).
- Overall, the 100-0 allocation performs best on average.
- There is considerable variability among individual countries for all statistics.
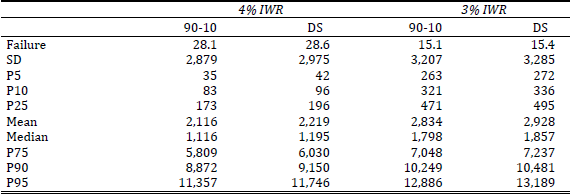
- For the 90-10 allocation with the simple dynamic twist (see the second table below):
- Average failure rates are slightly higher with the dynamic twist.
- Terminal wealth metrics are slightly higher with the dynamic twist.
The following table, taken from the paper, summarizes average statistics across 21 countries for fixed stocks-bonds allocations ranging from 100-0 to 30-70, all with 1,000 local currency units starting capital and 4% initial withdrawal rate, over 86 rolling 30‐year retirement periods. Reported statistics include portfolio failure rate (Failure), standard deviation of terminal values (SD), mean and median terminal values and terminal values at various percentiles (Pnn). Results indicate that 100-0 is generally the best allocation, followed by 90-10.

The next table, also from the paper, summarizes average statistics across 21 countries for two strategies both with starting capital 1,000 local currency units over 86 rolling 30‐year retirement periods:
- 90-10: static allocation of 90% to the local stock market and 10% to local short‐term government bonds, rebalanced annually.
- DS: the dynamic strategy specified above. If 5-year stock market performance exceeds long-term performance, the annual withdrawal comes from stocks with rebalancing to 90-10. If long-term performance exceeds 5-year performance, the annual withdrawal comes from bonds with no portfolio rebalancing.
The table shows two versions of each strategies, with alternative initial withdrawal rates (IWR) 4% or 3%. In general, the dynamic twist does not suppress average failure rate but offers slight enhancement of terminal wealth metrics.

In summary, available evidence indicates that Warren Buffett’s implied endorsement of a fixed 90-10 allocation is sensible, but not optimal, internationally. Adding the specified dynamic twist based on stock market return reversion offers mixed and modest results.
Cautions regarding findings include:
- Performance data are gross, not net. Construction of liquid tracking funds for country markets and annual rebalancing frictions would lower performance. Frictions likely vary considerably by country market and over time.
- The number of independent 30-year retirement intervals in the sample is small (less than four), so findings may not be representative of all retirements.
- Testing different strategies on the same data introduces snooping bias (luck), such that the best-performing strategy overstates expectations. Moreover, the dynamic twist stock market recovery interval of five years may be snooped (lucky) in the available data, thereby further overstating expectations.
- Given cautions regarding frictions, sample size and snooping bias, the value of the dynamic twist is dubious.