A reader requested that we evaluate the performance of Jim Rohrbach, president of Investment Models, Inc.. According to his web site, Mr. Rohrbach’s stock market timing service (based on the proprietary Rohrbach Index, or RIX) is “designed for timing retirement no-load mutual funds and individual stocks by avoiding stock market crashes and helping investors keep their IRA in bull markets and out of bear markets using technical analysis timing models.” He advises that: “The stock market can be timed!!! Don’t believe the ‘experts’ who tell you that it can’t be done.” Using his self-reported recent trading record, daily dividend-adjusted closes for S&P Depository Receipts (SPY) and daily yields for 13-week Treasury bills (T-bills) over the period 3/24/03 through 12/31/09, we find that:
Jim Rohrbach’s recent trading record lists 46 switches between stocks and cash during 3/24/03 through 12/31/09, starting with a BUY on 3/24/03 and ending with a BUY on 11/17/09. In analyzing this record, we make the following assumptions:
- Start with an initial investment of $10,000 (per Jim Rohrbach’s analysis).
- For Jim Rohrbach’s strategy, trade between SPY and cash at the close on the trade dates specified.
- Consider two benchmarks:
- Buy and hold SPY.
- Time SPY monthly using the 10-month simple moving average (SMA) of the S&P 500 Index by investing in SPY (cash) when the index is above (below) its 10-month SMA at the end of the month. Assume this strategy can anticipate signals sufficiently to trade at the monthly close with the signals. This benchmark strategy generates only five switches between stocks and cash over the sample period (at the ends of April 2003 into stocks, July 2004 into cash, October 2004 into stocks, November 2007 into cash and June 2009 into stocks).
- Use of dividend-adjusted values of SPY assumes reinvestment of dividends. (Jim Rohrbach’s analysis appears to ignore SPY dividends.)
- The return on cash is the T-bill yield. (Jim Rohrbach’s analysis appears to assume substantially higher returns on cash for some periods.)
- Assume one-way trading friction (transaction fee plus bid-ask spread) is 0.1% of the balance for Jim Rohrbach’s strategy trades and the 10-month SMA strategy trades. Ignore trading frictions for reinvestment of dividends.
- Assume an annual debit of $395 the last trading day of each year for Jim Rohrbach’s strategy to cover his fee. (Note that this fee is material for the assumed investment size.)
- Ignore tax implications of trading.
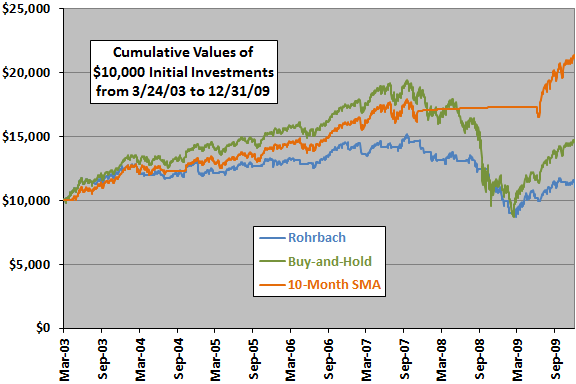
The following chart compares the cumulative values of $10,000 initial investments for Jim Rohrbach’s strategy and for the buy-and-hold and 10-month SMA benchmark strategies over the period 3/24/03 through 12/31/09. As modeled, Jim Rohrbach’s strategy lags both benchmarks all or most of the time. However, the sample period is short (especially for the 10-month SMA benchmark strategy).
Excluding Jim Rohrbach’s annual fee increases the terminal value of his strategy to nearly that of the buy-and-hold benchmark. Said differently, Jim Rohrbach’s strategy performance is more attractive compared to buy-and-hold (about the same terminal values with lower volatility) for an initial investment amount much larger than $10,000.
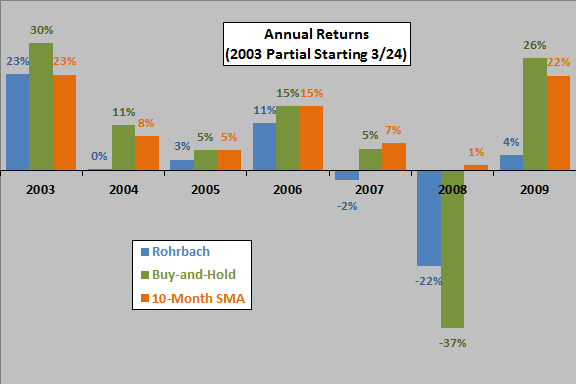
Since cumulative value analyses are sensitive to start and stop dates, we also look at annual returns.

The next chart compares the calendar year returns for Jim Rohrbach’s strategy and the two benchmark strategies, with 2003 a partial year commencing 3/24/03. Jim Rohrbach’s strategy beats the buy-and-hold (10-month SMA) strategy only in 2008 (2003). Again, the annual fee of $395 materially degrades the performance of Jim Rohrbach’s strategy.

In summary, evidence from straightforward tests on a fairly small sample does not support a belief that Jim Rohrbach’s timing approach (including service fees) beats simple benchmarks.
See “Jim Rohrbach’s Disagreement with Review of His Technical Timing Approach” for counterpoint.