Will increases in central bank and investor holdings of gold drive its price higher? Or, is the price of gold in bubble territory, portending weak future returns? In the May 2013 update of their paper entitled “The Golden Dilemma”, Claude Erb and Campbell Harvey investigate how investors should treat gold in asset allocation. They consider a range of arguments for owning gold, such as: (1) gold hedges inflation; (2) gold hedges currency decline; (3) gold is attractive when other assets are not; (4) gold is a safe haven in times of crisis; (5) gold is a de facto world currency; and, (6) central banks and investors in aggregate are still underweighting gold. Using gold price in U.S. dollars, the U.S. Consumer Price Index (CPI) and values of several currencies, mostly during January 1975 (the end of the government-fixed gold price era) through March 2012, they conclude that:
- From December 1999 through March 2012, gold appreciates 15.4% per year in U.S. dollars, compared to 1.5% for the U.S. stock market, 6.4% for the U.S. bond market and 2.5% for the CPI.
- Jewelry, central banks, investments and fabrication comprise about 50%, 18%, 18% and 12% of gold consumption, respectively, during 2001 through 2011. Central bank and investment demands have recently grown. Since 2004, SPDR Gold Shares (GLD) represent about 15% of total investment demand for gold.
- Recent evidence supports little belief in many widely expressed views of gold:
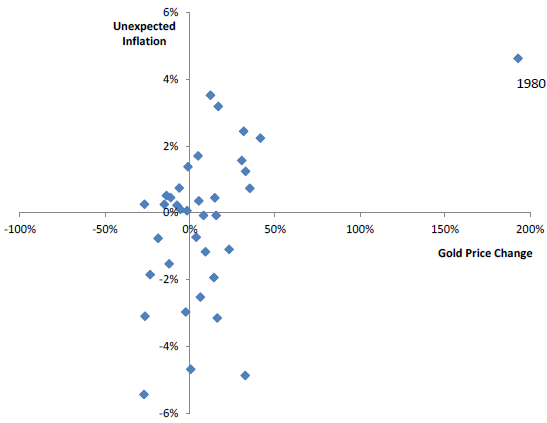
- Gold is not a reliable hedge for unexpected inflation. The price of gold fluctuates widely relative to CPI, with effectively no correlation between annual return on gold and annual change in inflation rate over the sample period (see the first chart below). A “gold as an inflation hedge” model based on tracking CPI suggests that gold should currently be about $780 an ounce. Gold may be a long-run inflation hedge, but the long run may be longer than an investor’s lifetime.
- Gold is not a reliable currency hedge. Fluctuations in the real price of gold greatly exceed those of currencies, and real gold price moves largely in unison across currencies with close to zero correlation.
- Gold does not reliably appreciate when returns on other assets are low. Since the inception of TIPS trading in 1997, the correlation between 10-year TIPS real yields and the real price of gold is -0.82. In other words, a high (low) real yield indicates a low (high) gold price.
- Gold is not a reliable safe haven asset. Monthly S&P 500 Index and gold returns are both negative for 17% of months since 1975, while gold returns are positive when stock market returns are negative for 20% of months.
- Gold does not reliably act as a “shadow currency.” Growth in the M1 (M2) measure of U.S. money supply suggests that the current price of gold should be about $8,000 ($37,000) per ounce, estimates unhelpful in understanding gold price dynamics.
- Technical perspectives based on recent data are:
- Momentum of the real price of gold is the dominant driver of short-term gold price and return since 1975.
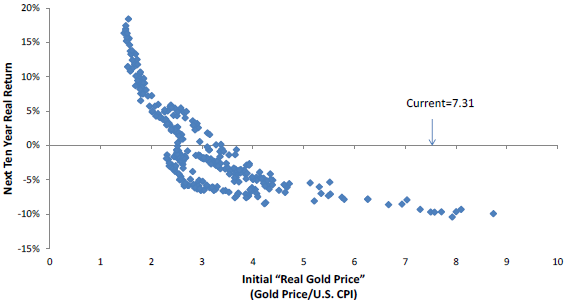
- Over longer horizons, the real price of gold exhibits mean reversion to a roughly flat trend. The real price of gold is currently very high relative to both its 1975-2011 and its 1791-2011 averages. Recent data suggests a future real annual return of about -10% (see the second chart below).
- Potential fundamental drivers may support a much higher price of gold:
- Based on a USGS estimate, gold mining output (surprisingly unresponsive to price) will exhaust unmined reserves in about 20 years.
- A move by key emerging market countries to boost per capita and per GDP holdings of gold to levels of developed market countries would exert substantial upward pressure on the price of gold.
- Currently, the value of gold available for investment is about 2% of the aggregate capitalization of world stock and bond markets, but very few investors hold 2% of their portfolio in gold. Widespread diversification into gold would exert upward pressure on the real and nominal price of gold. Moreover, while jewelry and technology demands for gold exhibit little or no price elasticity, that for investment demand is positive, with a 10% increase in price driving a 9.8% increase in demand.
The following chart, taken from the paper, relates annual change in the U.S. inflation rate (Unexpected Inflation) to annual gold return during 1975 through 2011. There is effectively no correlation, with any positive relationship driven by a single year (1980), undermining belief that gold acts as a hedge against inflation at an annual horizon.

The next chart, also from the paper, relates the real return of gold during overlapping 10-year intervals to its real price at the beginning of these intervals over the period 1975 through 2011. Results indicate mean reversion of the real price of gold at a 10-year horizon. Based on this analysis, the current high real price of gold suggests a real return of about -10% per year over the next decade.
However, the sample period is short in terms of independent 10-year intervals and may not be representative of future gold price dynamics.

In summary, evidence from current gold price dynamics suggests that growing central bank and investment diversification demands (with the latter exhibiting positive price elasticity) may drive gold prices much higher, but a technical perspective suggests a negative return.
Cautions regarding findings include:
- The post-1975 sample is small for testing some of the arguments presented.
- Comparability of data is arguable for long-term analyses.