Aggregate operating earnings as an indicator of future cash flows and the inflation rate as a fundamental wealth discount rate suggest a set of equity market valuation metrics, such as:
- Lagged earnings yield [Lagged E/P], where E is 12-month lagged aggregate operating earnings and P is the level of a corresponding index.
- Forward E/P, using a forecast of aggregate operating earnings for the next 12 months rather than lagged earnings. This metric underlies the Reversion-to-Value Model.
- Lagged E/P minus the lagged inflation rate [Lagged (E/P – I)], where I is the lagged 12-month inflation rate.
- Forward (E/P – I), using forecasts for both aggregate operating earnings and the inflation rate. This metric underlies the Real Earnings Yield (REY) Model.
- Forward E/P – Lagged I, because earnings forecasts arguably get much more attention than inflation rate forecasts. This metric underlies an alternate version of the REY Model.
How much have these metrics varied for the U.S. stock market, and where do they stand now? Using monthly estimates of actual and forecasted aggregate S&P 500 operating earnings, actual and forecasted inflation rates and monthly closes of the S&P 500 Index since March 1989, we find that:
The following table presents the high, low and current (using data available through 5/21/10) values of these metrics over the sample period. Two of the five metrics are at their sample period highs, one is near its high and the remaining two are closer to their highs than their lows. In other words, based only on highs and lows, three metrics indicate undervaluation and two are ambiguous but leaning toward undervaluation.
For a closer look, we map the values of the metrics over the sample period.

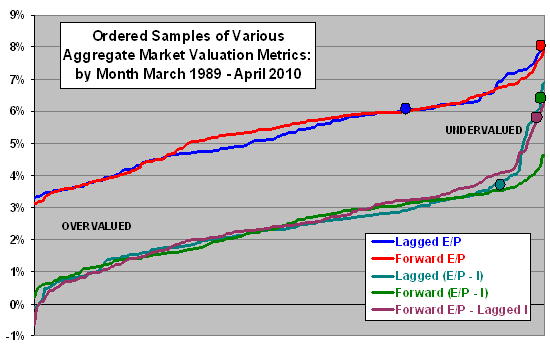
The following chart maps all five metrics in order of lowest to highest values over the sample period. The horizontal axis is therefore not time-sequential, and a vertical slice may represent different months for different metrics. The circles of matching colors indicate the current values of the metrics (as of the close on 5/21/10). Some notable points are:
- The distributions of the two metrics that do not use the inflation rate are similar, with pronounced tails at the “undervalued” ends. These tails suggest that undervaluations reach greater extremes than overvaluations.
- The distributions of the three metrics that use the inflation rate are similar, but those using the lagged inflation rate have more extreme tails. Conversely, using the inflation rate forecast makes the tail behavior look less extreme.
- Current values of the metrics are fairly bunched in the “undervalued” parts of the distributions (although two are not at the extreme ends).
Note that the linear regression approach used at “Market Models” suppresses information in the distribution tails.
How has the valuation map looked in the past?

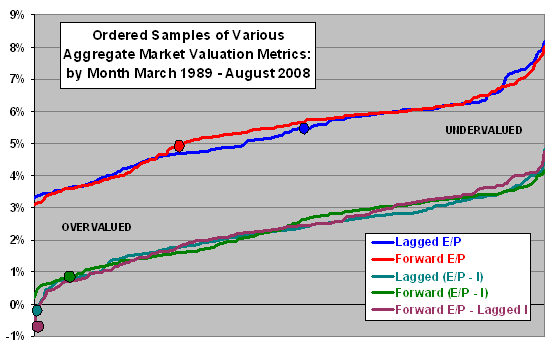
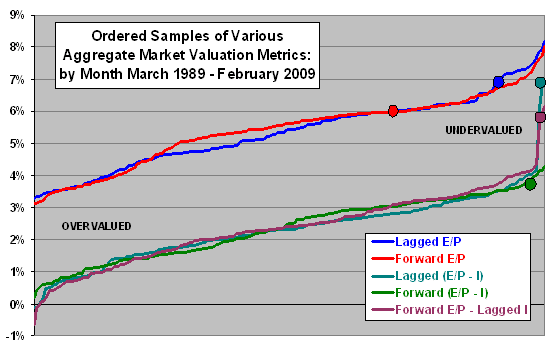
The last two charts are valuation maps as of August 2008 and February 2009, each using only data available from March 1989 through the map date. On both charts, the circles indicate values of the five metrics at the ends of the mapped periods. The map for August 2008 (February 2009) mostly indicates U.S. stock market overvaluation (undervaluation).
What limits the usefulness of such valuation maps?


The metrics may not be reliable for projecting future stock market returns because:
- Explanatory powers of the five metrics for future stock market returns are limited. For example, based on a linear best fit for data for March 1989 through April 2009, the least powerful metric (Lagged E/P) explains about 5% of the variation in 12-month future returns, and the most powerful (Forward E/P – Lagged I) explains about 24%.
- The sample periods since March 1989 may be unrepresentative (too short or from a distribution that is wild or adaptive). Potential lack of representativeness applies not only to the relationship between the metrics and future stock market returns but also the specifications of the models used to forecast aggregate operating earnings and the inflation rate. For example, the data used above do not include the experiences of the 1930s or the 1970s, to which some commentators have compared current conditions.
- Direct or second-hand data snooping bias derived from (1) metric selection, (2) use of multiple metrics and/or (3) earnings and inflation forecast rules and parameters may result in overstatement of the explanatory powers of the metrics.
In summary, simple U.S. stock market valuation metrics currently indicate (perhaps extreme) undervaluation, but these indications involve considerable uncertainty.