A subscriber requested verification of a fundamental U.S. stock market timing strategy with rebalancing/reallocation of a stocks-bonds portfolio based on Shiller cyclically adjusted price-to-earnings ratio (P/E10 or CAPE) thresholds, as follows:
- If P/E10 > 22, hold 40% stocks and 60% bonds.
- If 14 < P/E10 < 22, hold 60% stocks and 40% bonds.
- If P/E10 < 14, hold 80% stocks and 20% bonds.
The benchmark is an annually rebalanced 60% stocks-40% bonds portfolio (60-40). To assess reasonableness of the P/E10 thresholds chosen, we use P/E10 monthly levels since 1881 and S&P 500 Index monthly returns since 1927. To verify and assess robustness of the specified strategy (P/E10 Timing), we apply it to SPDR S&P 500 (SPY) since inception in 1993 as stocks and Vanguard Long-Term Treasury Investor Shares (VUSTX) as bonds, with monthly rebalancing/reallocation based on P/E10. We consider gross average monthly and annual returns, standard deviations of monthly and annual returns, compound annual growth rate (CAGR), maximum drawdown (MaxDD), and monthly and annual Sharpe ratio as strategy performance metrics. We use monthly and annual average monthly yield on 3-month U.S. Treasury bills (T-bill) to calculate Sharpe ratios. As an additional benchmark, we include a simple technical strategy that is in SPY when prior-month S&P 500 Index is above its 10-month simple moving average and VUSTX when it is below (SPY SMA10). Using the specified inputs, allowing a P/E10 Timing test of nearly 27 years, we find that:
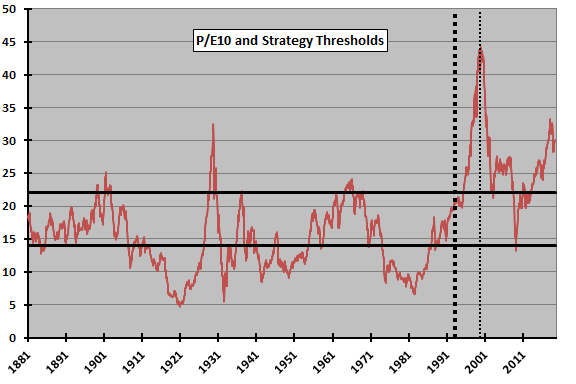
The following chart shows the evolution of P/E10 over the available sample period of January 1881 through April 2019 (the last available full 10-year calculation). Overall average is 17.0. The two heavy horizontal black lines at 14 and 22 are the specified P/E10 Timing strategy thresholds. The wide vertical black dotted line marks availability of SPY, so the test subperiod is to right of this line. The narrow vertical black dotted line marks initial publication of P/E10 data in the first edition of Irrational Exuberance. Notable points are:
- Behavior of P/E10 is markedly different before (average value 14.7) and after (average value 26.5) the start of the test subperiod. P/E10 is below the lower threshold of 14 only one month during the test subperiod.
- Lack of availability of P/E10 prior to 2000 confounds its use over the full test subperiod.
What are frequencies of months with P/E10 above, between and below the two thresholds?

The following table summarizes percentages of months in each range defined by the specified P/E10 thresholds over the full available sample period and during pre-test and test subperiods. Results confirm the dramatic difference in P/E10 behaviors between subperiods. Notable points are:
- It is arguable that an investor with access to the P/E10 history as of January 1993 would have selected thresholds other than 14 and 22.
- The lower threshold is practically irrelevant for the test subperiod.
For another perspective, we look at S&P 500 Index average monthly returns by threshold range.

The next table summarizes average S&P 500 Index average monthly returns after 1927 in each range defined by the specified P/E10 thresholds over the available sample period and during pre-test and test subperiods. Notable points are:
- An investor with access to the P/E10 history as of January 1993 may have selected the specified thresholds.
- The very high average return for P/E10 < 14 during the test subperiod is based on a single monthly return.
Next we look at P/E10 Timing performance.

As of mid-November 2019, P/E10 from Shiller data is complete (full 10 years of historical earnings) only through Apr 2019. We therefore lag P/E10 inputs by six months to ensure real-time availability.
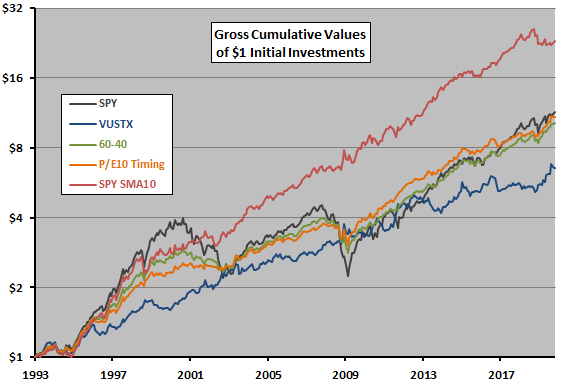
The next chart tracks on a logarithmic scale gross cumulative values of $1 initial investments in each of SPY, VUSTX, 60-40, P/E10 Timing and SPY SMA10 over the test subperiod. Though SPY wins the first eight years, SPY SMA10 is the clear winner over the full subperiod. The contest between P/E10 Timing and 60-40 is fairly close, but the former has the higher terminal value.
For perspective, we look at performance statistics.

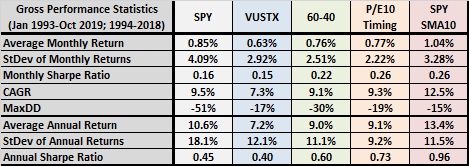
The final table summarizes gross performance statistics for all five alternative portfolios. For monthly results (including CAGR and MaxDD), the test subperiod is January 1993 through October 2019. For annual results, the test subperiod is 1994 through 2018. Notable points are:
- SPY SMA10 is the clear winner based on Sharpe ratios, CAGR and MaxDD.
- P/E10 Timing outperforms 60-40 by modest margins (comparable to those for annual rebalancing/reallocation from the subscriber).
How sensitive are results to specified parameter values?

Simple univariate sensitivity tests show that:
- Results are insensitive to the lower P/E10 threshold value and allocations to stocks and bonds for the low range of P/E10 (because there is only one month in the test subperiod with a value in the low range).
- The specified upper P/E10 threshold (22) is close to optimal.
- Optimal allocations to stocks and bonds for the high range of P/E10 is in the range 30-70 to 20-80, both of which produce somewhat higher CAGRs and annual Sharpe ratios, and somewhat shallower MaxDDs, than does the specified 40-60.
In summary, available evidence suggests that the specified P/E10 Timing strategy may be better than a simple 60-40 allocation.
Cautions regarding findings include:
- Performance statistics are gross, not net. P/E10 Timing and 60-40 bear similar rebalancing/reallocation frictions. SPY and VUSTX bear no frictions. SPY SMA10 frictions are probably much lower than those for P/E10 Timing and 60-40.
- VUSTX is a mutual fund, forcing a short delay in trading not included above.
- Optimality of the specified P/E10 upper threshold suggests data snooping, such that results for P/E10 Timing overstate expectations.
- The entire test subperiod is a bond bull market, with results therefore potentially overstating expectations. Using a shorter-duration bond fund would produce lower bond returns and may affect findings.
- As noted, P/E10 data are not available during most of the sample period, and part of the test subperiod. Availability of Shiller data throughout may have affected stock market behavior.
See the results of this search for other perspectives on use of P/E10 for market timing.