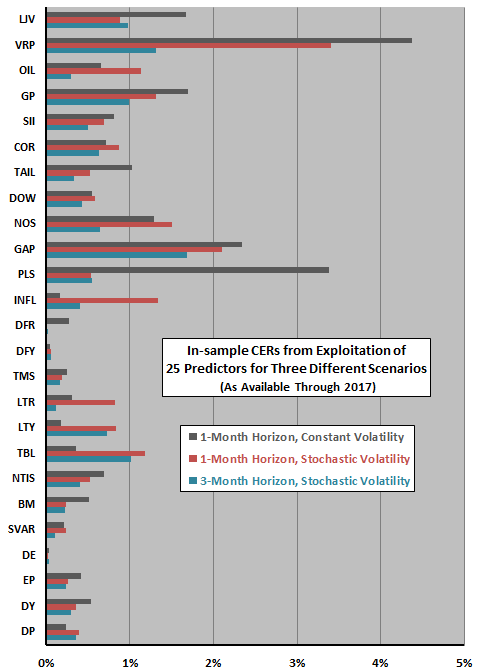
Are variables determined in published papers to be statistically significant predictors of stock market returns really useful to investors? In their November 2018 paper entitled “On the Economic Value of Stock Market Return Predictors”, Scott Cederburg, Travis Johnson and Michael O’Doherty assess whether strength of in-sample statistical evidence for 25 stock market predictors published in top finance journals translates to economic value after accounting for some realistic features of returns and investors. Predictive variables include valuation ratios, volatility, variance risk premium, tail risk, inflation, interest rates, interest rate spreads, economic variables, average correlation, short interest and commodity prices. Their typical investor makes mean-variance optimal allocations between the stock market and a risk-free security (yielding a fixed 2% per year) via Bayesian inference based on a vector autoregression model of market return-predictor dynamics. The investor has moderate risk aversion and a 1-month or longer investment horizon (reallocates monthly). Stock market returns and predictors exhibit randomly varying volatility. They focus on annual certainty equivalent return (CER) gain, which incorporates investor risk aversion, to quantify economic value of market predictability. Using monthly U.S. stock market returns and data required to construct the 25 predictive variables as available (starting as early as January 1927 and as late as June 1996 across variables) through December 2017, they find that:
- For a 1-month investment horizon and constant return volatility, annual gross CER gains from exploiting predictive variables in-sample range from 0.03% for dividend-earnings ratio to 4.37% for variance risk premium. For this scenario, ordinary least squares (OLS) R-squared effectively indicates CER gain.
- For a 1-month investment horizon and randomly varying return volatility:
- A Bayesian investor weights return predictions according to their precision, and therefore downweights (upweights) predictions when volatility is high (low).
- Also, a mean-variance investor downweights (upweights) allocations to the stock market during periods of high (low) market volatility.
- Overall, introducing randomly varying return volatility decreases (increases) CERs for 14 (11) of 25 stock market predictors, with the largest decreases occurring among the most recently discovered predictors. The relationship between conventional measures of in-sample statistical significance and CER gains is much weaker for the randomly varying volatility scenario than for the constant volatility scenario.
- CER gains tend to deteriorate as investment horizon (time between reallocations) lengthens, even from one month to three months. For example, annual CER gain from exploitation of the variance risk premium with constant volatility is 4.37% (1.00%) for a 1-month (3-month) horizon. (See the following chart.)
The following chart, constructed from data in the paper, summarizes effects on CER gains from exploiting predictive variables of: (1) introducing random variation in return and variable volatility; and, (2) extension of investment horizon from one to three months. Specifically:
- 1-Month Horizon, Constant Volatility – reallocates monthly with the assumption that returns and variables have constant volatility.
- 1-Month Horizon, Stochastic Volatility – reallocates monthly with the assumption that returns and variables have randomly varying volatility.
- 3-Month Horizon, Stochastic Volatility – reallocates quarterly with the assumption that returns and variables have randomly varying volatility.
Results indicate that progressively more realistic assumptions about exploitation of predictive values mostly, but not always, reduce their usefulness.

In summary, evidence indicates that, while statistically weak U.S. stock market predictors are sometimes economically useful, statistically strong predictors can be useless if they tend to: (1) take extreme values when volatility is high; (2) have low persistence; and/or, (3) have distributions with fat tails.
Said differently, academic studies of the power of financial, economic and technical variables to predict stock returns may not translate to commensurate portfolio gains.
Cautions regarding findings include:
- Analyses are gross, not net. Accounting for frictions from changing allocations between stocks and cash would reduce returns. Moreover, use of an index rather than a tradable fund to calculate stock market returns ignores costs of maintaining a liquid fund that tracks the market, and these costs vary over the long sample period.
- As noted, analyses are in-sample. Per the authors: “We purposefully abstract away from the potential difficulties in translating in-sample performance into out-of-sample gains to maintain this direct comparison [with prior research].” An investor operating in real time would therefore not have had all the information required for the allocation decisions tested.
- The assumed constant 2% risk-free annual yield is not realistic. The actual risk-free rate varies considerably over the sample period.
- Actual U.S. stock market volatility appears to cluster rather than vary randomly.
- Testing many predictive variables on the same sample introduces data snooping bias, such that the best-performing variables overstate out-of-sample expectations. Because the selected variables come from prior research, the set of variables inherits any snooping bias incurred in original discoveries.