Do complex valuation metrics outperform simple ones in predicting stock returns? In their July 2010 paper entitled “The Sophisticated and the Simple: The Profitability of Contrarian Strategies from a Portfolio Manager’s Perspective”, Daniel Giamouridis and Chris Montagu compare and contrast several simple and sophisticated valuation metrics, with focus on those of interest to equity portfolio managers. They consider three simple metrics: (1) forward price-earnings ratio (PE); (2) Book Yield (book price per share divide by share price); and, (3) Fair PE, derived from expected earnings growth and market capitalization. They consider sophisticated metrics as generated by two models: (1) the Residual Income Model (RIM), a function of current book value plus residual income; and, (2) the real options model (ROM), a convex function of earnings and book value. Using monthly firm fundamentals and return data for approximately 450 stocks that have been or are constituents of the MSCI Europe Index during January 1990 to April 2010, they find that:
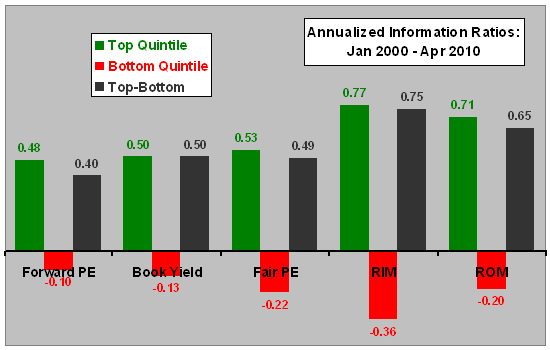
- The complex RIM and ROM outperform the simple metrics in predicting the cross-section of short-term gross future equity returns, translating to a portfolio-level annualized gross return advantage of up to 5% (see the chart below).
- RIM and ROM portfolios outperform the simple metrics on long-only and on long-short bases after accounting for transaction costs. ROM (RIM) induces the second-lowest (second-highest) average portfolio turnover. ROM has the highest risk-adjusted net returns. While RIM has fairly high portfolio turnover, its high returns more than compensate.
- RIM and ROM are less vulnerable to sector biases than the simple valuation metrics.
- RIM and ROM perform consistently during the value sell-off after August 2007 and stand out during the value rally starting in March 2009.
- ROM and to a lesser degree RIM appear to be the most appropriate valuation measures to combine with momentum.
The following chart, constructed from data in the paper, summarizes annualized information ratios for portfolios reformed monthly from the top and bottom quintiles of MSCI Europe Index stocks based on the five valuation metrics described above over the period January 2000 to April 2010. In broad terms, the top (bottom) quintile portfolio consists of stocks with high (low) earnings yields. The MSCI Europe Index is the reference for calculating the information ratios. Results indicate that the more complex RIM and ROM valuation metrics offer greater risk-adjusted gross returns than do the three simple valuation metrics.

In summary, evidence indicates that portfolios constructed from ranking stocks based on complex valuation metrics may materially outperform those constructed from simple valuation metrics.