Is the U.S. stock market in a Federal Reserve-driven bubble that is about to burst? In his August 2014 paper entitled “Fed by the Fed: A New Bubble Grows on Wall St.”, Oliver Dettmann examines how shifts away from quantitative easing by central banks, and the introduction of rising interest rates, may affect current valuation levels of the U.S. stock market. He focuses on a discounted real earnings model, employing a range of optimistic, moderate and pessimistic scenarios. Based on estimates of S&P 500 real earnings growth and an implied earnings discount rate derived from a sample period of January 1974 through June 2014, he finds that:
- Regarding the expected U.S. stock market real earnings growth rate:
- Due to flagging productivity gains, slow labor pool growth and declining investment, annual U.S. GDP real growth will likely hover around 2% until 2020 and slip to 1.5% during for the ensuing decade.
- The linear trend in S&P 500 real earnings growth is about 3.8%, but much higher in the second half of the sample period. The share of GDP represented by corporate profits is now two standard deviations above its historical average and likely unsustainable.
- Combining estimated income streams from within and outside the U.S., the estimated S&P 500 earnings growth rate is an average 2.9% per year over the next decade.
- Regarding the expected level of investor risk aversion (implied discount rate):
- The current implied discount rate of 6.5% is somewhat (less than one standard deviation) below the historical average of 6.85%.
- The end of a secular decline in nominal and real interest rates since the 1980s may signal a rising discount rate and trouble for stock valuations.
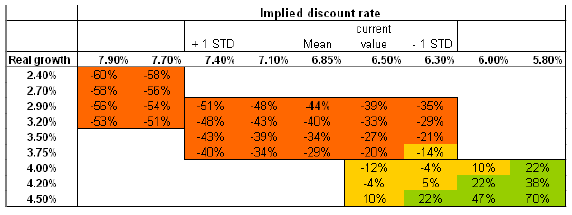
- Combining the expected real earnings growth rate and an average level of risk aversion suggests a U.S. stock market decline to fair value of more than 40% (see the chart below).
The following chart, taken from the paper, summarizes outcomes of a model combining investor risk aversion (implied discount rate) and expected real earnings growth rates to determine U.S. stock market fair value. The middle box of scenarios spans one standard deviation above and below the 6.85% historical mean of implied discount rate (a normal market environment). The box to the upper left covers scenarios for which the implied discount rate is above normal (market stress). The box to the lower right covers scenarios for which the implied discount rate is below normal (market euphoria). Estimates of the stock market real annual earnings growth rate span a ranges of 2.4% to 4.5% around the above projection 2.9%. Results suggest that:
- The historical mean implied discount rate of 6.85% and the expected real earnings growth rate of 2.9% translate to a stock market decline of 44% to fair value.
- An implied discount rate representative of market stress (> 7.4%) and the expected real earnings growth rate of 2.9% translate to a stock market decline of more than half.
- The current levels of the stock market and discount rate require an annual real earnings growth expectation of 4.5%.
- Substantial gains for the stock market require both very strong earnings growth and an implied discount rate last experienced in the late 1990s.
Most scenarios produce substantial declines to fair value.

In summary, results from a discounted earnings model suggest elevated U.S. stock market downside risk, arguing for a capital preservation investment stance.
Cautions regarding findings include:
- Parameter estimates and models such as those used above tend to have large uncertainties, exacerbated by a sample period that is not long in the context of a model that discounts expected annual earnings.
- Historical distributions of variable values may not be normal, so the historical average and standard deviation may not accurately represent their future values.
- It is arguable that results suggest looking for alternative asset classes likely to appreciate rather than preserving capital.