How well do different measures of stock quality perform as portfolio screens? In the May 2018 update of paper entitled “Does Earnings Growth Drive the Quality Premium?”, Georgi Kyosev, Matthias Hanauer, Joop Huij and Simon Lansdorp review commonly used quality definitions, test their respective powers to predict stock returns and analyze usefulness in constructing international stocks and corporate bonds settings. They consider the following definitions of quality:
- Industry – return on equity (ROE); earnings-to-sales ratio (margin); annual growth in ROE; total debt-to-common equity (leverage); and, earnings variability.
- Academia – gross profitability; accruals; and, net stock issues.
To compare predictive powers, at the end of each month they rank assets into fifths (quintiles) based on each metric and examine equally weighted performances of these quintiles. They calculate gross annualized average excess returns (relative to the risk-free rate) and gross annualized Sharpe ratios for the top and bottom quintiles and the difference between these two quintiles (top-minus-bottom). They also calculate four-factor (market, size, book-to-market and momentum) alphas for top-minus-bottom portfolios. They further analyze equally weighted combinations of all industry metrics and all academic metrics. They consider the largest stocks globally, regionally and from emerging markets. For robustness, they also consider samples of investment-grade and high-yield corporate bonds (with a 12-month rather than one-month holding interval). Using samples of relatively large non-financial common stocks for developed markets (starting December 1985) and emerging markets (starting December 1992) and samples of investment-grade and high-yield corporate bonds (starting January 1994) through December 2014, they find that:
- In general, industry quality metrics do not work well. When applied to developed equity markets in aggregate:
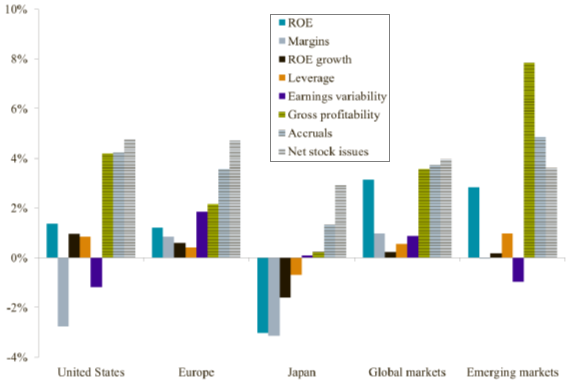
- All top-minus-bottom portfolios produce positive gross annualized average excess returns, led by ROE at 3.1%. The top-minus-bottom combination of quality metrics generates average gross annualized excess return 2.3%. However, none of the spreads are statistically reliable.
- Three of five top quintile portfolios (excepting leverage and ROE growth) have higher gross annualized Sharpe ratios than the market.
- Neither ROE alone nor the combination top-minus-bottom portfolios have statistically significant four-factor alphas, but earnings variability does (likely attributable to a low-volatility factor).
- In contrast, academic quality metrics do work. When applied to developed equity markets in aggregate:
- All top-minus-bottom portfolios produce significantly positive gross annualized average excess returns: 3.6% for gross profitability, 3.7% for accruals and 4.0% for net stock issues. The top-minus-bottom combination of quality metrics generates average gross annualized excess return 6.2%.
- All three top quintile portfolios outperform the market.
- Top-minus-bottom portfolios for all three individual metrics and their combination generate highly significant positive four-factor alphas.
- Academic metrics are regionally strongest in emerging markets and Europe, and weakest in Japan. Industry metrics perform poorly in all regions.
- Results are also similar for corporate bonds. Bonds issued by high quality companies outperform those issued by low quality companies, and academic quality definitions work better for both investment-grade and high-yield bond samples.
- Quality metrics predict stock returns only if they uniquely forecast earnings growth.
The following chart, taken from the paper, compares gross annualized average excess returns for all top-minus-bottom quality metric stock portfolios specified above across developed market regions, developed markets overall and emerging markets. Academic metrics consistently have positive returns and outperform industry metrics.

In summary, evidence indicates that firm/stock quality definitions used by academics are generally much more predictive of future asset returns than those used by industry.
Cautions regarding findings include:
- As noted in the paper, portfolio performance data are gross, not net. Accounting for monthly portfolio reformation and shorting costs would reduce returns. Shorting may not always be feasible as specified.
- Different quality specifications may drive different turnovers, such that net relative performance of metrics may differ from gross relative performance.
- Testing many different metrics on the same data introduces snooping bias, such that results for the best-performing metrics are lucky and overstate expectations.
- The study update does not extend samples used, which end in 2014.