Does growth in a firm’s operating costs signal trouble for its stock? In their June 2014 preliminary paper entitled “Cost Growth and Stock Returns”, Dashan Huang, Fuwei Jiang, Jun Tu and Guofu Zhou examine the relationship between growth in operating costs and future stock returns. They measure operating cost growth as the annual percentage change in costs of goods sold plus selling, general and administrative expenses. They speculate that high cost growth warns of deteriorating profitability. Since analysts and investors focus on earnings and cash flows, they may not fully appreciate the import of cost growth. To ensure that cost growth data is available for public signaling, they relate stock return for July through June of year t+1 to accounting data as of the end of firm fiscal year t-1. Using accounting data from 1963 through 2012 and associated stock returns during July 1968 through 2013 for a broad sample of U.S. common stocks, they find that:
- High cost growth predicts significant deterioration in subsequent operating performance.
- Cost growth relates negatively to future stock returns. An annually reformed hedge portfolio that is long (short) the equally weighted tenth of stocks with the lowest (highest) past cost growth:
- Produces a gross average annual return of 13.5%, with gross average annual return for the long side about 19%.
- Generates a gross annual three-factor (market, size, book-to-market) alpha of 12%.
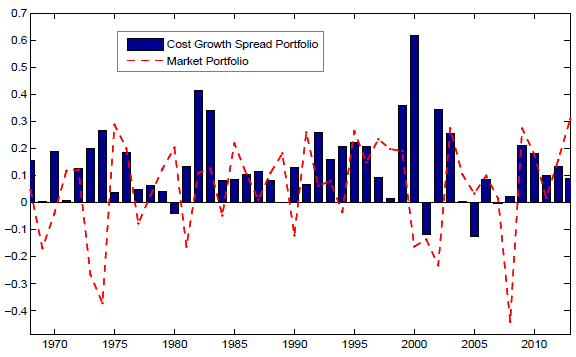
- Has positive gross returns in 42 of 46 years in the sample period, including 2008 (see the chart below).
- While the cost growth effect is strongest among very small stocks, a capitalization-weighted hedge portfolio still produces a gross average annual return of 7.3%.
- The cost growth effect persists but weakens over about five years after public data release.
- The cost growth effect is stronger among firms with low investor attention (small capitalization, low analyst coverage), high valuation uncertainty (young, high turnover, high idiosyncratic volatility) and high transaction costs (illiquid, low dollar trading volume).
- The cost growth effect remains significant after controlling for size, book-to-market ratio, momentum, monthly reversal, accruals, net operating assets, investment-to-asset ratio, asset growth, investment growth, abnormal capital investment and sales growth.
The following chart, taken from the paper, tracks gross annual returns of an annually reformed hedge portfolio that is long (short) the equally weighted tenth of stocks with the lowest (highest) past cost growth over the entire sample period. The chart also shows for comparison the annual excess returns (relative to one-month U.S. Treasury bills) of the broad value-weighted U.S stock market. Hedge portfolio returns are positive in 42 of 46 years. Correlation of annual hedge portfolio returns with annual market excess returns is -0.29, indicating that the hedge portfolio is a good diversifier.

In summary, evidence indicates that investors may be able to exploit the substantially negative relationship between growth in firm operating costs and future stock returns.
Cautions regarding findings include:
- Reported results are gross, not net. Incorporating reasonable trading frictions and shorting costs, which vary considerably over the sample period, would reduce portfolio returns. Relatively infrequent (annual) portfolio reformation mitigates this concern. However, shorting may not be feasible for some high-cost growth stocks.
- Data collection and processing required to exploit the cost growth effect may be burdensome, or costly if delegated.
- Many investors may not be able to hold portfolios diversified enough to exploit the cost growth effect reliably.