Why does the gross profitability stock-screening strategy work? In their December 2013 paper entitled “Factoring Profitability”, Michael Branch, Lisa Goldberg and Ran Leshem explore the drivers of the gross profitability strategy for U.S. stocks. Specifically, they examine the contributions of factors in the conventional Fama-French-Carhart four-factor (FFC4) model of equity returns and the Barra USE4 12-factor model of equity returns to an idealized, industry-neutral gross profitability strategy. They define gross profitability as revenue minus cost of goods sold divided by assets. Idealized means a hedge portfolio that is each month long (short) stocks of firms in the top (bottom) fifth of gross profitability with no rebalancing frictions. Industry-neutral means constraining industry weights in the portfolio to equal those in the market index. Using stock price and accounting data and contemporaneous asset pricing model factor values as available during July 1963 through December 2012, they find that:
- The FFC4 model explains 27% (47%) of idealized gross profitability strategy returns during July 1963 (July 1995) through December 2012. During July 1995 through December 2012, the strategy tilts modestly toward stocks with large capitalizations and low betas.
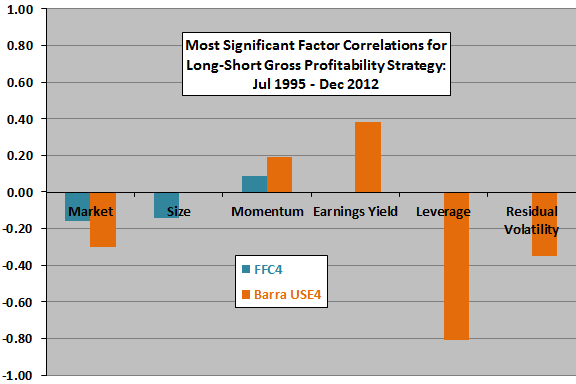
- The Barra USE4 model explains 69% of idealized gross profitability strategy returns during July 1995 through December 2012. The strategy tilts toward stocks of high quality (low beta, high earnings yield, low leverage, low residual volatility) and high momentum.
- The book-to-market ratio factor does not contribute to the gross profitability strategy during July 1995 through December 2012.
The following chart, constructed from data in the paper, summarizes the most significant factor contributions to the idealized gross profitability strategy returns during July 1995 through December 2012. Positive (negative) values means the strategy tilts toward stocks with high (low) values of the factor.

In summary, evidence from tests with available factor data indicate that the gross profitability strategy is largely a firm quality (low beta, high earnings yield, low leverage, low residual volatility) strategy.
Cautions regarding findings include:
- As noted by the authors, the idealized (long-short, frictionless) gross profitability strategy overstates performance by ignoring trading frictions from rebalancing turnover and the cost/infeasibility of maintaining short positions in stocks of relatively unprofitable firms.
- As noted by the authors, the recent sample period is short in terms of business/economic cycles.
- The paper is vague regarding gross profitability portfolio construction.