Are there any gold trading strategies that reliably beat buy-and-hold? In their April 2018 paper entitled “Investing in the Gold Market: Market Timing or Buy-and-Hold?”, Viktoria-Sophie Bartsch, Dirk Baur, Hubert Dichtl and Wolfgang Drobetz test 4,095 seasonal, 18 technical, and 15 fundamental timing strategies for spot gold and gold futures. These strategies switch at the end of each month as signaled between spot gold or gold futures and U.S. Treasury bills (T-bill) as the risk-free asset. They assume trading frictions of 0.2% of value traded. To control for data snooping bias, they apply the superior predictive ability multiple testing framework with step-wise extensions. Using monthly spot gold and gold futures prices and T-bill yield during December 1979 through December 2015, with out-of-sample tests commencing January 1990, they find that:
- The average monthly spot and futures gold return (excess return relative to T-bills) during the 1990-2015 test period is 0.31% (0.07%).
- Average monthly spot/futures net returns for the top five:
- Seasonal trading strategies are 0.51%-0.56%.
- Technical trading strategies are 0.53%-0.61%.
- Fundamental trading strategies are 0.45%-0.53%.
- After correcting for data snooping bias:
- No seasonal trading strategy significantly outperforms buy-and-hold.
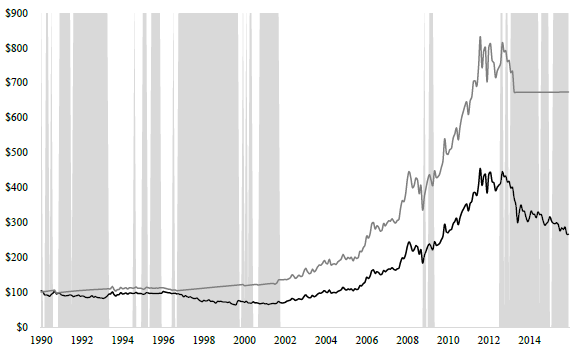
- One to three technical trading strategies, led by 24-month momentum (????????????24, see the chart below), significantly outperform buy-and-hold, depending on test restrictiveness.
- No fundamental trading strategy significantly outperforms buy-and-hold.
- Any outperformance of trading strategies appears to derive from behaviorally induced trends and not from systematic reactions to broader market or economic conditions.
The following chart, taken from the paper, compares cumulative values of $100 investments in the most statistically robust trading strategy (MOM24, grey line) and buy-and-hold (black line) over the test period. Shaded grey areas indicate bear markets in gold. Results indicate that MOM24 outperforms by avoiding a few extended drawdowns in gold price.

In summary, evidence indicates that a few long-term trend trading rules may be effective for spot gold and gold futures.
Cautions regarding findings include:
- Some traders may not be able to achieve the assumed level of trading frictions.
- Those rules identified as significantly useful generate only a few trades over the 25-year test period.
See also “Testing Consistency of Potential Gold Price Drivers” and “Gold Price Drivers?”.