Do firms with predictable sales seasonality continually “surprise” investors with good high season (bad low season) sales and thereby have predictable stock return patterns? In their May 2018 paper entitled “When Low Beats High: Riding the Sales Seasonality Premium”, Gustavo Grullon, Yamil Kaba and Alexander Nuñez investigate firm sales seasonality as a stock return predictor. Specifically, for each quarter, after excluding negative and zero sales observations, they divide quarterly sales by annual sales for that year. To mitigate impact of outliers, they then average same-quarter ratios over the past two years. They then each month:
- Use the most recent average same-quarter, two-year sales ratio to predict the ratio for next quarter for each firm.
- Rank firms into tenths (deciles) based on predicted sales ratios.
- Form a hedge portfolio that is long (short) the market capitalization-weighted stocks of firms in the decile with the lowest (highest) predicted sales ratios.
Their hypothesis is that investors undervalue (overvalue) stocks experiencing seasonally low (high) sales. They measure portfolio monthly raw average returns and four alphas based on 1-factor (market), 3-factor (market, size, book-to-market), 4-factor (adding momentum to the 3-factor model) and 5-factor (adding profitability and investment to the 3-factor model) models of stock returns. Using data for a broad sample of non-financial U.S common stocks during January 1970 through December 2016, they find that:
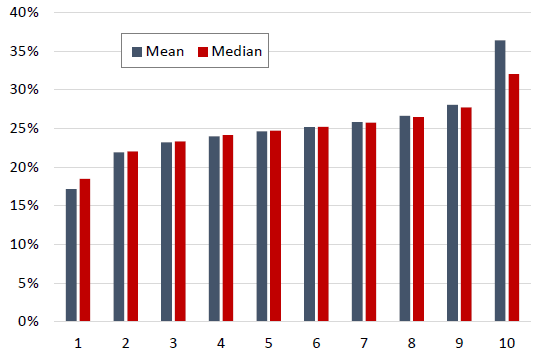
- Firms in the lowest (highest) seasonality decile generate an average 17.4% (33.8%) of annual sales during their low (high) seasons. (See the chart below.) About 80% of lowest decile stocks are also highest decile stocks during the same calendar year.
- The sales seasonality hedge portfolio generates average gross monthly return 0.70%, with gross monthly alphas ranging from 0.65% to 0.75% across the four factor models.
- Hedge portfolio returns and alphas come mainly from the long side. The lowest (highest) seasonality decile has average gross monthly return 0.87% (0.17%) and gross monthly 5-factor alpha 0.57% (-0.17%).
- The sales seasonality effect strengthens over time. Hedge portfolio average gross monthly returns (5-factor alphas) during 1977-1986, 1987-1996, 1997-2006 2007-2016 are 0.50%, 0.63%, 0.71% and 1.19% (0.45%, 0.43%, 0.78% and 1.25%), respectively.
- Results are stronger among firms with extreme swings in quarterly sales. Restricting the hedge portfolio to stocks of firms most likely to move back and forth between highest and lowest sales seasonality deciles boosts gross monthly alpha to 1.26%.
- Hedge portfolio performance tends to be stronger among stocks of large, low book-to-market, profitable and high-investment firms. Equally weighting stocks in the portfolio lowers alphas.
- Sales seasonality amplifies some other anomalies. For example:
- Average gross monthly return of the lowest (highest) sales seasonality decile is significantly higher among high-momentum stocks (lower among low-momentum stocks). Double sorting on momentum and sales seasonality accordingly boosts gross monthly alpha to 1.53%.
- Post-earnings announcement drift is significantly stronger for the lowest sales seasonality decile than the highest. The lowest (highest) decile has average gross drift 1.66% (0.62%) over the 45 days after announcement.
- The sales seasonality effect is:
- Independent of previously documented seasonal anomalies and does not derive from variations in liquidity, analyst forecast dispersion, idiosyncratic volatility or financing decisions.
- Positive across economic expansions and contractions.
- Not compensation for tail risk. In fact, the hedge portfolio generates gross monthly alpha 1.46% during 2007-2009.
The following chart, taken from the paper, compares monthly average (mean) and median ratios of quarterly firm sales to annual firm sales by sales seasonality decile, ranging from 17.4% for the lowest to 33.8% for the highest. Results indicate that investors do not efficiently process this predictable cycle when trading associated stocks.

In summary, evidence indicates that investors tend to underprice (overprice) materially stocks of firms during predictably weak (strong) sales seasons.
Cautions regarding findings include:
- Reported returns and alphas are gross, not net. Accounting for monthly hedge portfolio turnover and shorting costs would reduce their values. Shorting may not always be feasible due to lack of shares to borrow. By definition of the sales seasonality variable, hedge portfolio turnover is about 100% per quarter.
- Sales seasonality hedge portfolio returns and alphas do not monotonically decline across deciles, undermining confidence in its reliability.
- Testing multiple strategy variations on the same data introduces data snooping bias, such that the best-performing variations overstates expectations. There may also be hidden or inherited snooping bias in the study.
- Data collection/processing and portfolio maintenance are beyond the reach of many investors, who would bear fees for delegating to an investment/fund manager.