The Fed Model relates the aggregate earnings yield (E/P) of the stock market to Treasury bond or bill yields under the assumption that investors view equities and government bonds as competing ways to achieve yield. Might supply (company management), rather than demand (investors), more precisely drive the relationship between E/P and interest rates? In the April 2011 (incomplete) draft of his paper entitled “Understanding the Fed Model, Capital Structure, and then Some”, J.H. Timmer argues that the stock market earnings yield tends to equilibrium not with the government bond yield but with the average after-tax corporate bond yield as companies adjust capital structure (mix of equity and bonds) to maximize earnings per share. SEC Rule 10b-18 (explicitly allowing share repurchases) enabled fine adjustment toward equilibrium as of 1982. Using annual estimates of one-year forward earnings yields and corporate bond yields for a subset of S&P 500 companies and assuming a constant corporate tax rate of 30% over the period 1968 through 2006, he finds that:
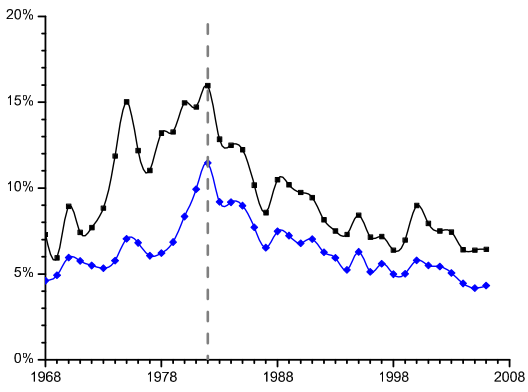
- A strong correlation between aggregate E/P and average corporate bond yield emerges after implementation of SEC Rule 10b-18 in 1982 (see the chart below).
- The Fed Model works only when the after-tax yield on corporate bonds is roughly equal to the government bond yield.
The following chart, taken from the paper, compares annual estimates of the one-year aggregate forward E/P excluding extraordinary items (black line) to annual estimates of the average after-tax Baa corporate bond yield (blue line) for those S&P 500 companies for which the former is greater than or equal to the latter over the entire sample period. The vertical dashed line marks 1982, when SEC Rule 10b-18 becomes effective. Visual inspection suggests that operating E/P and average after-tax bond yield are highly correlated after that year.

In summary, evidence suggests a tendency to equilibrium between aggregate stock market earnings yield and average corporate bond yield after 1982.
Is this observation of any use to investors? For example, does the gap between aggregate E/P and average Baa bond yield predict future stock returns?
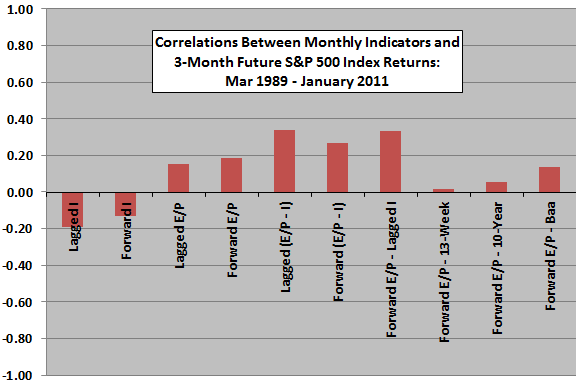
The following chart summarizes correlations between ten indicators, sampled at month ends, and three-month future returns for the S&P 500 Index over the period March 1989 through January 2011 (the last month for which a three-month future return is available). The indicators are:
- Consumer inflation rate over the prior 12 months [Lagged I].
- Forecasted inflation rate over the next 12 months [Forward I].
- S&P 500 operating E/P over the prior 12 months [Lagged E/P].
- Forecasted S&P 500 operating E/P over the next 12 months [Forward E/P, corresponding to RTV-F at Market Models].
- The gap between Lagged E/P and Lagged I [Lagged(E/P – I), corresponding to REY-L at Market Models].
- The gap between Forward E/P and Forward I [Forward(E/P – I), corresponding to REY-F at Market Models].
- The gap between Forward E/P and Lagged I [Forward E/P – Lagged I), corresponding to REY-M at Market Models].
- The gap between Forward E/P and the yield on the 13-week Treasury bill [Forward E/P – 13-Week].
- The gap between Forward E/P and the yield on the 10-year Treasury note [Forward E/P – 10-Year].
- The gap between Forward E/P and the yield on Baa corporate bonds [Forward E/P – Baa].
Results suggest that the gap between Forward E/P and Baa yield is more useful for forecasting stock market returns than Treasury instrument yields but less useful than Forward E/P alone and indicators that measure the gap between E/P and inflation. Inflation appears to outperform interest rates as an earnings discount factor.
Note that one-year Treasury note and Baa bond yields for a month are averages over the business days of the month, whereas other measurements are month-end. This difference in data could affect results.

A caution regarding results is that model-level data snooping bias rises as the number of alternative model specifications increases, tending to overstate the performance of the best model.
See “Market Models” and “Real Earnings Yield (REY) Model Details” for additional information on relating aggregate operating E/P to the inflation rate.