Do markets exploitably misprice stocks? In their July 2017 paper entitled “Global Market Inefficiencies”, Söhnke Bartram and Mark Grinblatt assess the exploitability of deviations from fair stock prices worldwide based on publicly known accounting data. Specifically, they each month:
- Regress market capitalizations of all stocks sampled on 21 annual accounting variables from most recently disclosed balance sheets and income/cash flow statements. Returns play no role, suppressing potential snooping bias.
- Calculate percentage mispricings of stocks as regression residuals (unexplained by accounting variables) divided by market capitalization.
- Rank stocks into fifths (quintiles) based on within-country percentage mispricings.
- Group stocks in the same quintile across countries globally, by developed or emerging, or by region (Europe, Asia Pacific, Americas, and Africa/Middle East).
- Calculate next-month equal-weighted and value-weighted gross returns and alphas by quintile and for a hedge portfolio that is long (short) the most underpriced (overpriced) quintiles. Alphas derive from eight risk factors (market, size, book-to-market, investment, profitability, momentum, short-term reversal, and long-term reversal) calculated by region.
- Estimate the impact of quintile portfolio rebalancing frictions on gross returns/alphas.
To suppress rebalancing frictions, they also consider a holding interval of 12 months (averaging returns of 12 overlapping portfolios formed each month and held for a year). They run tests controlling for past returns, earnings surprises, country effects and other possible sources of abnormal returns. Using monthly values of 21 annual accounting variables for more than 25,000 non-financial firms, associated stock returns and stock trading frictions from 36 countries during March 1993 through December 2016, they find that:
- The largest numbers of stocks are from the U.S (35%) and Japan (17%), followed by South Korea (7%), China (6%), France (5%), the UK (4%), Canada (4%) and Germany (4%).
- Undervalued firms tend to have low market capitalizations, high book-to-market ratios, low accruals, low market betas and low returns over the past month, 12 months and five years.
- For equal-weighted quintiles, average returns increase systematically from the most overvalued to the most undervalued firms, with average monthly gross extreme quintile spread 0.53%. This spread is:
- Positive in 62% of months.
- Largely driven by non-U.S. and non-Europe stocks (0.60% versus 0.26% in the U.S. and 0.08% in Europe).
- Largest for emerging markets (1.23%) and Asia Pacific (1.09%).
- Modestly smaller for value-weighted quintiles.
- Gross monthly alpha patterns are similar to return patterns. Extreme quintiles contribute about equally to gross alpha.
- Turnover for a monthly rebalanced global hedge portfolio is 39% per month, driving frictions over 40% of gross monthly alpha (reducing alpha from 0.59% to 0.33%). Emerging markets have especially high monthly turnover (52%) and especially large frictions (0.79%). Frictions are lowest for the U.S.
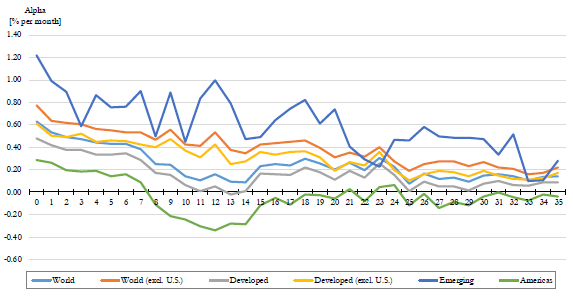
- Mispricing signal effectiveness decays more rapidly in the U.S. compared to other developed markets and (especially) emerging markets (see the chart below).
- For the alternative 12-month holding interval, gross profitability is lower, particularly for Asia Pacific but less so for the U.S., Europe and emerging markets. Annually rebalancing cuts frictions by about 80%, with significant net alphas surviving for all except Europe, the United States and the Americas. Significant alphas range from 3.3% per year in developed markets to 8.6% per year in emerging markets. Loss of profitability from stale signals more than offsets reduced frictions, except in emerging markets.
- The mispricing measure is not proxy for known anomalies.
The following chart, taken from the paper, summarizes mispricing signal alpha decays by region for lags ranging from 0 to 35 months. In general, alphas decline as the signal becomes older. The decline is most pronounced in the large U.S. subsample. In contrast, declines are slower in emerging markets and developed markets outside the U.S., consistent with lower market efficiencies outside the U.S.

In summary, evidence suggests that investors trading stock market mispricings should focus on emerging markets and the Asia Pacific region.
Cautions regarding findings include:
- The sample period is not long in terms of annual accounting inputs and variety of global economic and market conditions.
- Timely information may be costly for some countries.
- The data collection/processing effort is beyond the reach of most investors, who would bear fees for delegating to a fund manager.