Issuers of exchange-traded notes (ETN) publish daily indicative (immediate redemption) values for these debt instruments. Does deviation of the market price of an ETN from its indicative value represent an exploitable mispricing? In their September 2012 paper entitled “Mispricing and Trading Profits in ETNs”, Dean Diavatopoulos, Helyette Geman, Lovjit Thukral and Colby Wright investigate the gross profitability of a simple weekly trading strategy that buys (sells) ETNs priced under (over) associated indicative values. Specifically, they identify mispricings at the close each Tuesday (to avoid holiday and weekend effects), enter equally weighted positions at the next open and exit one week later. They test mispricing thresholds ranging from 0.50% to 20%. To assure liquidity, they specify target ETNs based on minimum average daily share volumes of 20,000 (34 ETNs), 50,000 (15 ETNs), 100,000 (12 ETNs) or 250,000 (seven ETNs). They ignore trading frictions, liquidity issues and shorting costs/constraints. Using Tuesday closing prices and indicative values and Wednesday opening prices for the specified ETNs during June 2006 through January 2012 (5.7 years), they find that:
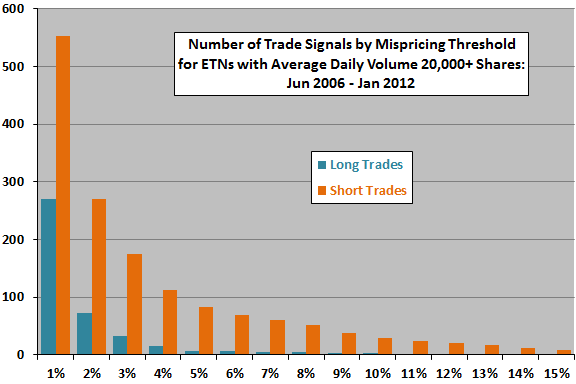
- The number of trade signals during the sample period naturally decreases as the mispricing threshold increases, with (see the first chart below):
- Short signals (ETN overpriced) much more frequent than long signals (ETN underpriced).
- The number of long signals very low for thresholds offering gross profitability.
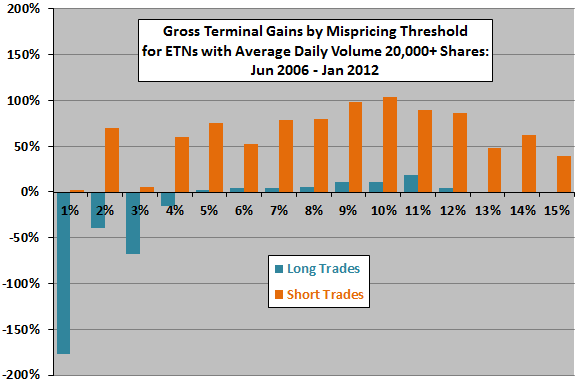
- Gross cumulative gains over the sample period mostly increase as the mispricing threshold increases, with (see the second chart below):
- Short trades much more profitable than long trades on a gross basis.
- Peak gross cumulative gain peaking for thresholds in the 8%-11% range.
- Limiting the set of ETNs considered to increasingly liquid assets (higher average daily trading volumes) generally reduces the number of trades and weakens gross profitability.
The following charts, constructed from data in the paper, summarize the total number of long and short trade signals (upper chart) and the gross terminal gains of trading those signals (lower chart) over the entire sample period for ETN mispricing thresholds ranging from 1% to 15%. The set of ETNs considered consists of all those with average daily trading volume of at least 20,000 shares.
The first chart shows that the number of trade signals decreases rapidly as the mispricing threshold increases, with short signals much more frequent than long signals. The number of long signals for 5%, 10% and 15% thresholds are 7, 3 and 0, respectively.

The second chart shows that gross profitability generally increases with the mispricing threshold and that short trades are much more profitable (on a gross basis) than long trades.

In summary, evidence from an idealized strategy provides little support for a belief that investors can reliably exploit mispricing of ETNs relative to associated indicative values on a net basis.
Cautions regarding findings include:
- The very low numbers of long signals for (modestly) mispricing thresholds offering gross profitability over the 5.7-year sample period makes the long side of the strategy uninteresting.
- As noted in the paper, trading frictions, shorting costs and the potential infeasibility of shorting (no shares to borrow) are problematic for the short trades. The authors acknowledge that these assumptions leave “a largely theoretical exercise.”
- The minimum average daily share volume specifications may not be adequate to support large trades (without large impact of trading on ETN prices).
- Buying and holding the S&P 500 Index is at best a marginally relevant benchmark for the ETN mispricing strategy, which involves timing of many non-equity assets.