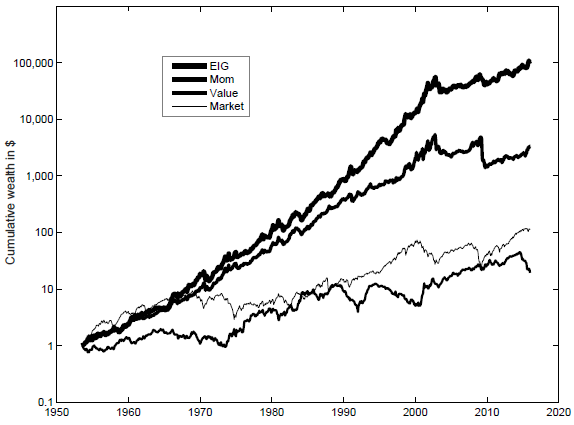
Do stocks with expectations of high capital expenditures (growth opportunities) outperform those with expectations of low capital expenditures? In their December 2016 paper entitled “Expected Investment Growth and the Cross Section of Stock Returns”, Jun Li and Huijun Wang examine the power of expected investment growth (EIG) to predict cross-sectional stock returns. They construct EIG for each stock monthly in two steps:
- Regress actual investment (capital expenditures) growth jointly versus prior-month momentum (stock return from 12 months ago to two months ago), q (firm market value divided by capital) and cash flow.
- Apply the resulting regression betas to latest momentum, q and cash flow values to project next-month EIG.
They measure the EIG factor premium as gross average return to a portfolio that is each month long (short) the value-weighted tenth, or decile, of stocks with the highest (lowest) EIGs. They consider an array of tests to measure the strength and robustness of this factor premium. Using monthly data for a broad sample of U.S. stocks (excluding financial and utility stocks) during July 1953 through December 2015, they find that:
- A hedge portfolio that is each month long (short) the decile of stocks with the highest (lowest) EIGs generates average gross annual return 20.8% with gross Sharpe ratio 1.01 and does not suffer from large negative skewness or high kurtosis. (See the chart below.)
- The long (short) side of this portfolio generates average gross annual return 15.2% (-5.6%) with standard deviation 22.6% (27.4%).
- Gross annual alphas relative to various factor models of stock returns range from 12.9% for the conventional 4-factor model (market, size, book-to-market, momentum) to 24.0% for the conventional 3-factor model (excluding momentum).
- Results are similar for two equal subperiods (break point December 1984), with average gross annual hedge portfolio returns 19.7% during the first subperiod and 21.9% during the second (both translating to gross annual Sharpe ratio 1.01).
- Limiting stocks to NYSE, S&P 500 Index or those priced greater than $5 results in average gross annual returns (gross annual Sharpe ratio) 11.1% (0.47), 6.3% (0.28) or 16.6% (0.79), repsectively.
- The EIG factor premium is especially large for stocks that are difficult to trade and/or exhibit information uncertainty (high idiosyncratic volatility, low institutional ownership, low analyst coverage, high analyst forecast dispersion).
- Annual EIG factor premiums across G7 markets range from 8.7% (Sharpe ratio 0.44) in Japan to 33.8% (Sharpe ratio 0.99) in Germany.
The following chart, taken from the paper, compares gross cumulative values of $1 initial investments in:
- EIG: The EIG hedge portfolio as specified above and applied to all NYSE/AMEX/NASDAQ common stocks, excluding financial and utility stocks.
- Mom: A comparably specified momentum hedge portfolio.
- Value: A comparably specified value (book-to-market ratio) portfolio.
- Market: The market portfolio in excess of the risk-free rate.
The latter three portfolios are scaled to have the same standard deviation as the EIG hedge portfolio. Terminal values are $10,673, $3,326, $19 and $112, respectively. Since the end of 2000, cumulative returns are 358%, 10%, 143% and 105%, respectively.

In summary, evidence indicates that stocks with high EIG substantially and consistently outperform those with low EIG on a gross basis.
Cautions regarding findings include:
- Reported performance metrics are gross, not net. Accounting for monthly portfolio reformation frictions and shorting costs would reduce these values. Moreover, profitability concentrates in stocks that are most costly to trade and short.
- Data acquisition/processing requirements are substantial, beyond the reach of most investors. Delegating these processes to a an investment manager would involve fees.
- Cross-sectional stock return factors based on U.S. data arguably involve aggregate/cumulative snooping bias as addressed in “Taming the Factor Zoo”, thereby overstating statistical significance.