Do strongly accelerating firm earnings identify future outperforming stocks? In the October 2017 revision of their paper entitled “Earnings Acceleration and Stock Returns”, Shuoyuan He and Ganapathi Narayanamoorthy investigate the power of earnings acceleration (quarter-over-quarter change in earnings growth, which is year-over-year change in quarterly earnings) to predict abnormal stock returns. They test a hedged trading strategy that long (short) the equal-weighted tenth, or decile, of stocks with the highest (lowest) earnings acceleration for two holding intervals: (1) starting two days after earnings announcement and ending on day 30; and, (2) starting two days after earnings announcement and ending one day after the next quarterly earnings announcement. They allocate new earnings accelerations to deciles based on the prior-quarter distribution of values of earnings acceleration. They define abnormal return as that in excess of the capitalization-weighted market return. Using quarterly firm characteristics and earnings data and daily returns for a broad sample of U.S. stocks, excluding financial and utility stocks, during January 1972 through December 2015, they find that:
- Profitability of earnings acceleration decile portfolios increases systematically from lowest to highest.
- The earnings acceleration hedge portfolio specified above generates average gross abnormal return 1.8% (3.4%) over the ensuing month (quarter). For the 1-month holding interval:
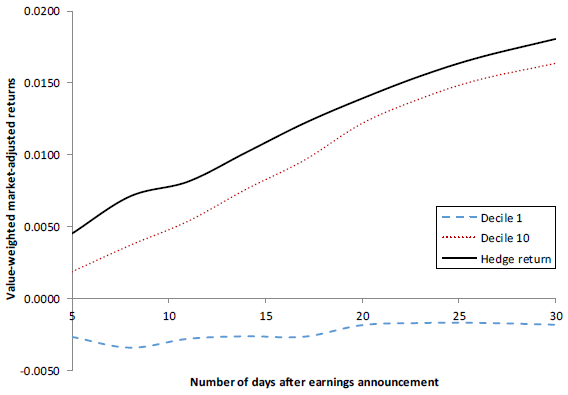
- Average gross monthly abnormal return is 1.6% (-0.2%) for the long (short) side. (See the chart below.)
- Over the full sample period, hedge portfolio gross abnormal returns are positive in 140 of 176 fiscal quarters (80%).
- During 2004 through 2015, hedge portfolio gross abnormal returns are positive in 41 of 48 fiscal quarters (85%).
- Findings are generally robust to (but often weakened by):
- Use of value-weighted rather than equal-weighted deciles.
- Exclusion of stocks priced less than $5 and with market capitalizations less than $0.5 billion.
- A strategy modification that is at the beginning of each month long (short) the top (bottom) earnings acceleration decile of stocks announcing earnings during the previous month. This easier-to-execute strategy has average gross monthly abnormal return about 1%.
- Controlling for size, book-to-market ratio, momentum, gross profitability, investment (asset growth), post-earnings announcement drift, profit trend, gross profitability, accruals and past earnings volatility.
- A strategy refinement that concentrates the earnings acceleration effect boosts average gross abnormal return from 1.8% to 2.6% for the 1-month holding interval. This strategy specifies:
- The long side consists of stocks from the top earnings acceleration decile, with positive earnings growth in both the previous and current quarters.
- The short side consists of stocks from the bottom earnings acceleration decile, with earnings growth in the previous (current) quarter positive (negative).
- There are also significant 3-day abnormal returns around earnings announcements two and three quarters after earnings acceleration measurement. Findings suggests that investors do not understand implications of earnings acceleration for future earnings growth.
The following chart, taken from the paper, tracks average gross cumulative abnormal returns from five days to 30 days after earnings announcement for:
- Decile 1 – The equally weighted bottom earnings acceleration decile.
- Decile 10 – The equally weighted top earnings acceleration decile.
- Hedge return – A portfolio that is long Decile 10 and short Decile 1.
On average, stocks in Decile 1 underperform immediately after earnings announcement and thereafter drift with the market over the next month to -0.2% at day 30. On average, stocks in Decile 10 outperform consistently to 1.6% at day 30. The average gross hedge abnormal return at 30 days is therefore 1.8%.

In summary, evidence indicates that stocks with exceptionally high (low) earnings accelerations compared to those observed during the prior quarter outperform (slightly underperform) the market over the month and quarter after earnings announcement.
Cautions regarding findings include:
- The baseline strategy would be difficult to implement since the number of positions varies over time based on the flow of earnings announcements. At times there would be many open positions and at other times few, likely necessitating large cash reserves (which would substantially lower overall performance).
- Reported returns are gross, not net. The featured 1-month horizon requires trading in and out (or out and in) of each extreme decile stock within one month, with associated trading frictions reducing returns. Shorting costs and constraints would likely make the short side of the earnings acceleration hedge portfolio unprofitable.
- Testing multiple strategies on the same data (for example, from considering multiple ways to enhance the base strategy) incorporates snooping bias, such that the optimal enhancement overstates expectations.
- The general approach is beyond the reach of most investors, who would bear fees for delegating to a fund manager.
See also: