A reader commented and asked: “One of the most read investing books in the U.S. is Joel Greenblatt’s The Little Book that Beats the Market, which reveals the ‘magic formula’. What do you think of it?” In response, rather than review the book, we examine the U.S. Value Direct Composite returns at Formula Investing. These returns summarize the composite performance of portfolios of professionally managed (minimum $100,000) accounts each holding approximately 24 stocks with the highest rank per the magic formula, reformed quarterly by replacing the six worst performers with the highest ranking stocks not in the portfolio. Portfolio weights are apparently about equal, subject to rotation rule constraints. According to Formula Investing:
“The S&P CompuStat database is used for the screening of U.S. listed stocks, with the exception of financials and utilities. The stocks are screened for our best ranked companies based on return on capital and earnings yield.”
“Returns are presented net of investment advisory fees and include the reinvestment of all income. For the period May 1, 2009 – December 31, 2010, the composite includes accounts that received a temporary waiver of the advisory fee. …Net returns may be reduced by additional fees (outside of investment advisory fees) and transaction costs that may be incurred in the management of the account.”
Using monthly U.S. Value Direct Composite returns as presented and contemporaneous monthly returns of the dividend-adjusted Rydex S&P 500 Equal Weight (RSP) and dividend-adjusted iShares Russell 2000 Index (IWM) as benchmarks for May 2009 through June 2011 (27 months), we find that:
Since the U.S. Value Direct Composite portfolios are apparently about equally weighted, RSP is a more suitable benchmark than the capitalization-weighted S&P 500 Total Return Index presented at Formula Investing. Because the CompuStat database includes many more stocks (with smaller market capitalizations) than the S&P 500 Index, the “magic formula” may tend to select relatively small stocks, and we also consider IWM as a potentially relevant (though capitalization-weighted) benchmark.
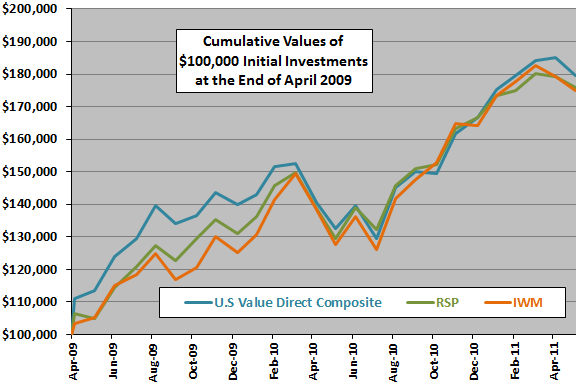
The following chart compares the cumulative values of $100,000 initial investments in the U.S. Value Direct Composite, RSP and IWM over the available sample period. Outcomes are not much different for the three series. The early lead of the U.S. Value Direct Composite comes entirely from its inaugural-month outperformance, which may represent a lucky start. In fact, starting the contest at the end of all of months May 2009 through March 2010 puts the “magic formula” in third place at the end of June 2011.
Also, as noted above, the U.S. Value Direct Composite includes some accounts with waived investment advisory fees and “returns may be reduced by additional fees (outside of investment advisory fees) and transaction costs.”
For another perspective, we look at monthly return statistics.

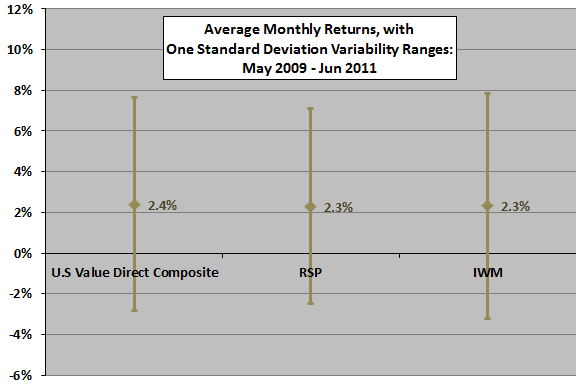
The next chart shows the average monthly returns, with one standard deviation variability ranges, for the U.S. Value Direct Composite, RSP and IWM over the available sample period. Statistics are similar for the three series, with RSP and IWM having slightly lower average monthly returns than the “magic formula” and RSP (IWM) having slightly lower (higher) return volatility.
Excluding the first month of the sample eliminates the average return edge of the U.S. Value Direct Composite.
Again, the U.S. Value Direct Composite includes some accounts with waived investment advisory fees and “returns may be reduced by additional fees (outside of investment advisory fees) and transaction costs.”
What is the trend in monthly performance of the U.S. Value Direct Composite relative to RSP and IWM?

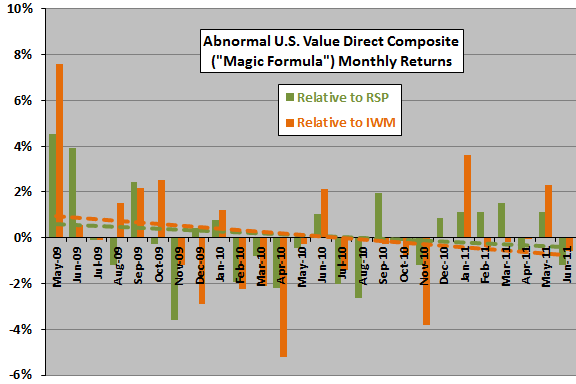
The final chart tracks the monthly returns of the U.S. Value Direct Composite minus same-month RSP and IWM returns over the available sample period, along with color-matched dashed trend lines. Results show that, with the first month of data included, abnormal performances of U.S. Value Direct Composite relative to RSP and IWM both decline. Excluding the first month eliminates the downtrends but also eliminates any indications of outperformance over the sample period.
Again, the U.S. Value Direct Composite includes some accounts with waived investment advisory fees and “returns may be reduced by additional fees (outside of investment advisory fees) and transaction costs.”

In summary, evidence from simple tests on a limited sample does not support a belief that the “magic formula” outperforms reasonable exchange-traded fund benchmarks in real use.
Cautions regarding findings include:
- Given the frequency of portfolio reconstitution and the rate at which stock selection indicators change, the sample is very short (only about nine quarters) for reliable testing of the “magic formula” valuation methodology. The sample includes no bear markets.
- There may be some other benchmark more suited than either RSP or IWM to the actual portfolio weights and distribution of market capitalizations within the U.S. Value Direct Composite.