Can financial statement analysis expose stocks that investors incorrectly view as value or growth (glamor)? In their February 2011 paper entitled “Identifying Expectation Errors in Value/Glamour Strategies: A Fundamental Analysis Approach”, Joseph Piotroski and Eric So investigate stock misvaluation by contrasting firm performance expectations implied by value/growth classification with a simple financial statement metric that differentiates improving versus deteriorating financial performance. This metric (FSCORE, scale 0 to 9), based on nine binary financial statement parameters, measures both the overall financial condition of a firm and the degree to which the firm has improved this condition over the prior year. The authors examine how FSCORE interacts with five widely used relative valuation metrics (book-to-market ratio, cash flow-to-price ratio, earnings-to-price ratio, sales growth and equity share turnover) and with momentum. Using annual financial data and stock returns for a broad sample of firms over the period 1972 through 2008 (117,412 firm-year observations), they find that:
- FSCORE relates positively to book-to-market, earnings-to-price and cash flow-to-price ratios and negatively to sales growth and equity turnover.
- Firms with high FSCOREs tend to realize significantly higher gross future stock returns than those with low FSCOREs, consistent with investor underreaction to changing firm financial condition. For example, firms with FSCORE > 7 ( < 3) generate an average next-year gross return of 19.1% (6.6%), or 5.5% (-4.3%) on a size-adjusted basis.
- The value premium concentrates in firms whose financial data conflicts with expectations based on a value/growth label, as though investors indiscriminately bundle value and growth stocks and ignore differences within bundles. Among (value) growth stocks, FSCORE most successfully identifies future winners (losers), consistent with FSCORE identifying overly pessimistic (optimistic) expectations.
- Corroborating its effectiveness as a predictor of abnormal returns, FSCORE is a leading indicator of future analyst forecast errors, forecast revisions and returns around earnings announcements.
- A positive (negative) relationship between past and future returns is evident only when upward (downward) six-month momentum coincides with improving (deteriorating) financial performance. For example, the average gross six-month future return for high-momentum/high-FSCORE (high-momentum/low-FSCORE) stocks is 12.4% (1.2%).
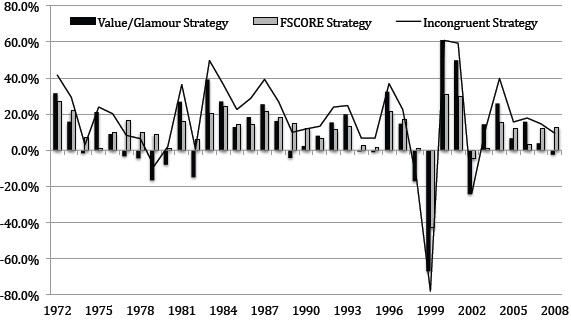
The following chart, taken from the paper, presents size-adjusted annual (July-June) gross returns for three hedge portfolios over the entire 1972-2008 sample period:
- The Value/Glamor Strategy is long (short) the 30% of stocks with the highest (lowest) value based on a composite of the five traditional valuation metrics identified above.
- The FSCORE strategy is long (short) stocks with an FSCORE > 7 (< 3) for the prior year.
- The Incongruent Strategy, combining traditional valuation metrics with FSCORE fundamental valuation, is long (short) high-value/high-FSCORE (low-value/low-FSCORE) stocks.
The Incongruent Strategy generally produces highest size-adjusted returns, is positive in 33 of 37 years and beats the Value/Glamor Strategy in 34 of 37 years.

In summary, evidence indicates that investors may be able to enhance the performance of traditional valuation strategies and momentum strategies by combining them with Piotroski’s FSCORE ratings.
Reasons to be cautious about these findings include:
- Return calculations are gross. While trading is infrequent under the portfolio formation rules used, trading frictions would dent reported performance. It is possible that the stocks making the largest gross profitability contributions to the strategies are the least liquid and therefore the costliest to trade.
- Compilation of FSCOREs for a large number of stocks indicates considerable data collection and analysis costs not addressed in the study.
- Reliable exploitation of the findings requires holding a reasonably diverse portfolio of favored stocks, requiring at least a moderate amount of capital.