How does the Cyclically Adjusted Price-to-Earnings ratio (CAPE, or P/E10) behave during the COVID-19 pandemic? What are its current implications? In the November 2020 revision of their paper entitled “CAPE and the COVID-19 Pandemic Effect”, Robert Shiller, Laurence Black and Farouk Jivraj examine behavior of CAPE during 2020 in the U.S., UK, Europe, Japan and China, highlighting the impact of the pandemic. They apply CAPE to generate current 2-year, 5-year and 10-year equity return forecasts based on full-sample regressions. They then extend the CAPE forecasting approach to forecast changes in excess real return of stocks over bonds (see the chart below) to explore why investors strongly prefer equities over bonds during the pandemic. Finally, they look at sector dynamics within each economy. Using Shiller data during January 1871 through September 2020, they find that:
- From a low of 23 in late March 2020, U.S. CAPE rebounds to 32 (about the 90th percentile of full history values) by the end of September 2020. Since 1881, average CAPE is 17. Over the last 20 years, average CAPE is 25.6.
- Current CAPE-forecasted 10-year equity returns are about 3% for the U.S., 8% for the UK, 5% for Europe and 6% for Japan. Pandemic effects have materially boosted UK forecasted return.
- Current forecasted premiums between real equity returns and real 10-year bond returns are about 4% for the U.S., 3% for the UK, 0% for Europe and 5% for Japan. Pandemic effects have materially boosted U.S. and UK premiums, increasing relative attractiveness of equities in those markets.
- From a sector perspective:
- Industrials, energy and finance perform poorly during the pandemic.
- Healthcare performs well.
- Technology and communication services drive U.S. and Chinese equity market recoveries.
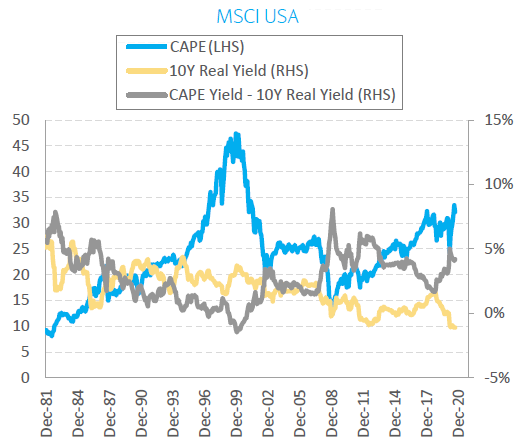
The following chart, taken from the paper, tracks U.S. equity market CAPE on the left hand scale (LHS) and both 10-year bond yield and the premium between CAPE yield and 10-year bond yield on the right hand scale (RHS) since the end of 1981. Notable points are:
- CAPE is relatively high, but still well below its technology bubble peak.
- 10-year real bond yield is very low.
- The premium of CAPE yield minus 10-year bond real yield is relatively high, explaining the recent attractiveness of U.S. stocks.

In summary, equity markets snap back from COVID-19 lows quickly, perhaps because plunging real bond yields inflate the equity risk premium.
Cautions regarding findings include:
- A recent sample is short in terms of number of independent 10-year earnings intervals and number of independent 10-year return forecasts.
- Testing the historical accuracy of CAPE as a return forecasting tool using full in-sample data introduces considerable lookahead bias and may therefore mislead. An investor operating in real time could not have produced such forecasts. See “Usefulness of P/E10 as Stock Market Return Predictor”.
For related research see “Fed Model Improvement?” and results of this search.