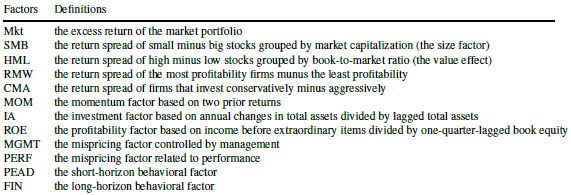
Which equity factors from among those included in the most widely accepted factor models are really important? In their October 2019 paper entitled “Winners from Winners: A Tale of Risk Factors”, Siddhartha Chib, Lingxiao Zhao, Dashan Huang and Guofu Zhou examine what set of equity factors from among the 12 used in four models with wide acceptance best explain behaviors of U.S. stocks. Their starting point is therefore the following market, fundamental and behavioral factors:
They compare 4,095 subsets (models) of these 12 factors models based on: Bayesian posterior probability; out-of-sample return forecasting performance; gross Sharpe ratios of the optimal mean variance factor portfolio; and, ability to explain various stock return anomalies. Using monthly data for the selected factors during January 1974 through December 2018, with the first 10 (last 12) months reserved for Bayesian prior training (out-of-sample testing), they find that:
- A 6-factor model of U.S. stock returns, consisting of Mkt, SMB, MOM, ROE, MGMT and PEAD risk factors has:
- The highest Bayesian posterior probability.
- Better out-of-sample predictive power, higher gross mean-variance optimal Sharpe ratio and greater ability to price stock return anomalies than all widely accepted input models.
- Specifically, the gross mean-variance optimal Sharpe ratio of this model is 15% higher than that of the highest factor input model.
- In close second and third places are a 7-factor model that adds PERF and a 5-factor model that subtracts MOM, respectively. The fourth place model is not close.
In summary, evidence indicates that the optimal model of U.S. stock returns includes five to seven factors encompassing fundamental and behavioral effects.
Cautions regarding findings include:
- Analyses are gross, not net. Exploitation of factors involves periodic reformation of factor portfolios, with associated trading frictions and shorting costs/constraints. Some factor portfolios may be much more costly to maintain than others, such that the optimal net model differs from the optimal gross model.
- Testing a large number of models on the same data introduces data snooping bias, such that performance of near-optimal models overstates expectations for future performance.
- Many analyses presented in the study are highly mathematical.
- Exploitation of the optimal models is beyond the reach of most investors, who would bear fees for delegating to a fund manager.
For two other recent relevant perspectives, see “Sifting the Factor Zoo” and “Emptying the Equity Factor Zoo?”.