A subscriber proposed an alternative to the strategy tested in “Using P/E10 Thresholds to Time the U.S. Stock Market”, which rebalances a stocks-bonds portfolio based on Shiller cyclically adjusted price-to-earnings ratio (P/E10 or CAPE) thresholds, as follows:
- If P/E10 > 22, hold 40% stocks and 60% bonds.
- If 14 < P/E10 < 22, hold 60% stocks and 40% bonds.
- If P/E10 < 14, hold 80% stocks and 20% bonds.
The alternative strategy (P/E10 Variable Timing) uses linear scaling of the allocation to stocks from 40% to 80% as the P/E10 rises from 14 to 22. To test the alternative, we apply it to SPDR S&P 500 (SPY) since inception in 1993 as stocks and Vanguard Long-Term Treasury Investor Shares (VUSTX) as bonds, with monthly rebalancing/reallocation based on P/E10. We consider gross average monthly and annual returns, standard deviations of monthly and annual returns, compound annual growth rate (CAGR), maximum drawdown (MaxDD), and monthly and annual Sharpe ratio as strategy performance metrics. We use monthly and annual average monthly yield on 3-month U.S. Treasury bills (T-bill) to calculate Sharpe ratios. The benchmark is the original strategy (P/E10 Fixed Timing). Using the specified inputs, allowing a test of nearly 27 years, we find that:
As in the original analysis, we lag P/E10 inputs by six months to ensure real-time availability.
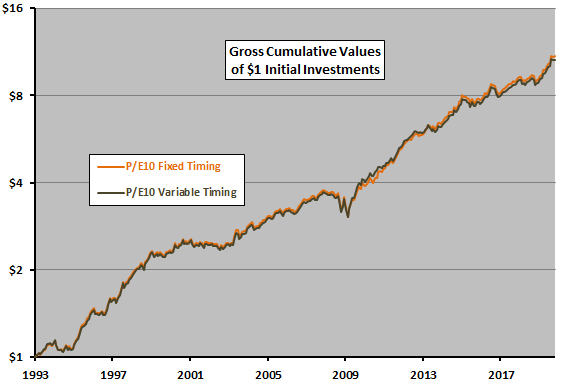
The following chart tracks on a logarithmic scale gross cumulative values of $1 initial investments in P/E10 Fixed Timing and P/E10 Variable Timing over the test period. Results for the two approaches are nearly indistinguishable.
For perspective, we look at performance statistics.

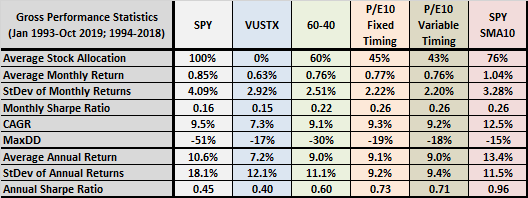
The following table summarizes gross performance statistics for P/E10 Fixed Timing, P/E10 Variable Timing and the four other portfolios described in “Using P/E10 Thresholds to Time the U.S. Stock Market”. For monthly results (including CAGR and MaxDD), the test period is January 1993 through October 2019. For annual results, the test period is 1994 through 2018. Results confirm that P/E10 Fixed Timing and P/E10 Variable Timing are barely different.
For additional insight, we look at allocations to stocks over time.

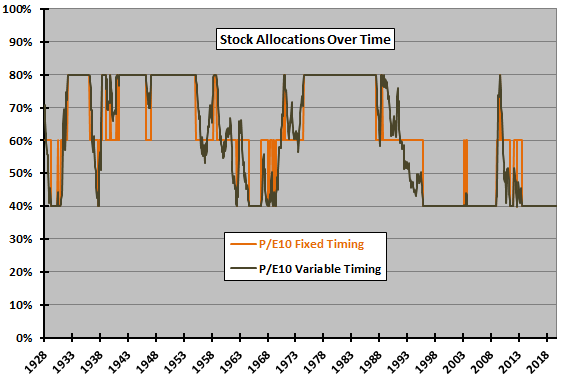
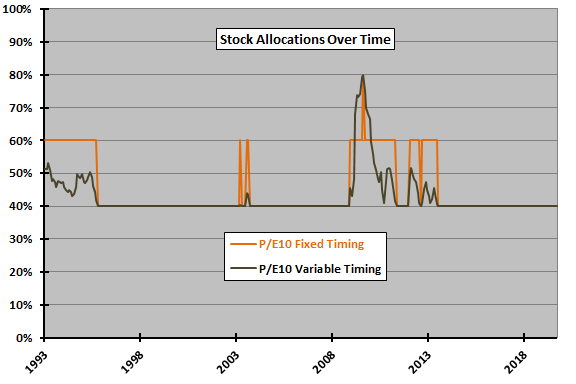
The following two charts track P/E10 Fixed Timing and P/E10 Variable Timing allocations to stocks over an extended sample period back to 1928 (upper chart) and the recent period used for testing above (lower chart). The lower chart shows that times when allocations differ between alternative strategies are relatively infrequent compared to times when they agree at 40%.


In summary, evidence does not support belief that P/E10 Variable Timing is superior to P/E10 Fixed Timing over the past 26+ years.
Cautions regarding findings include:
- Cautions in “Using P/E10 Thresholds to Time the U.S. Stock Market” apply.
- Testing multiple strategy variations on the same sample introduces data snooping bias, such that outcome differences may be due to luck rather than reliable principle.