Is there a better stock value ratio than commonly used ones such as book-to-market, dividend-to-price, earnings-to-price and cash flow-to-price ratios? In the January 2020 revision of his paper entitled “A New Value Strategy”, Baolian Wang investigates the effectiveness of cash-based operating profitability-to-price (COP/P) as a value ratio. He computes COP as operating profitability minus accruals, with operating profitability defined as revenue minus cost of goods sold and reported selling, general and administrative expenses (not including expenditures on research and development). He each year at the end of June sorts stocks into tenths, or deciles, based on COP/P and then calculates next-month excess returns for a value-weighted or equal-weighted hedge portfolio that is long (short) the decile with the highest (lowest) values of COP/P. Using monthly returns and annual, 6-month lagged and groomed accounting data for non-financial U.S. common stocks during 1963 through 2018 period, he finds that:
- Compared to several other value metrics, COP/P is most like cash-flow to price, with annual correlation 0.30.
- Next-month returns increase almost systematically from lowest to highest deciles of COP/P, so its predictive power is not just a tail effect.
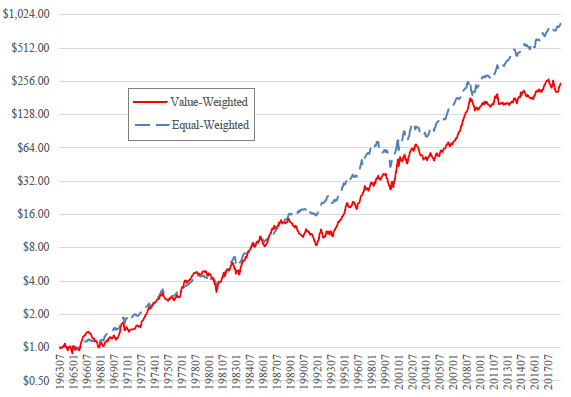
- The hedge portfolio specified above generates 0.91% (1.08%) average monthly gross excess return for value (equal) weighting, translating to 11% (13%) annualized. (See the chart below.)
- 5-factor model monthly gross alphas (adjusting for market, size, book-to-market, profitability and investment factors) are 0.63% for value weighting and 0.69% for equal weighting.
- Returns are stronger in the second half of the sample period (January 1991 to December 2018) than the first (July 1963 to December 1990). For example, average monthly gross excess return for the value-weighted hedge portfolio is 1.04% (0.78%) for the second (first) half.
- The effect is weaker among large firms than small firms. For example, average monthly gross excess return for the value-weighted hedge portfolio is 0.38% (0.96%) for firms the largest (smallest) third of NYSE market capitalization breakpoints.
- COP/P is a stronger predictor of stock returns than other commonly used valuation ratios, including book-to-market, dividend-to-price, earnings-to-price and cash flow-to-price. It also subsumes the asset growth effect (low investment firms outperform high investment firms).
The following chart, taken from the paper, tracks cumulative gross values of $1 initial investment in the hedge portfolio specified above with either value or equal weighting over the full sample period. Performance is fairly steady throughout the sample period.

In summary, evidence indicates that cash-based operating profitability-to-price is superior to widely used stock value ratio for capturing the equity value premium.
Cautions regarding findings include:
- Findings are gross, not net. Accounting for annual portfolio reformation frictions would reduce returns and alphas. Concentration of the effect among small stocks exacerbates this concern. However, portfolio reformation is infrequent, and frictions of competing valuation ratios may be similar.
- The author draws on prior studies in constructing his new valuation ratio and reuses data from these studies, thereby importing any data snooping bias in them. Also, the new metric adds to zoo of stock factors, with attendant elevation of aggregate snooping bias across the research community.
- The hedge portfolio method described is beyond the reach of most investors, who would bear fees for delegating to a fund manager.