Which widely used valuation metric is best for picking individual stocks? In their November 2011 paper entitled “Analyzing Valuation Measures: A Performance Horse-Race over the past 40 Years”, Wesley Gray and Jack Vogel compare the performances of five annually reformed portfolios sorted on different valuation ratios: earnings-to-market capitalization (E/M); earnings before interest, taxes, depreciation and amortization-to-total enterprise value (EBITDA/TEV); free cash flow-to-total enterprise value (FCF/TEV); gross profit-to-total enterprise value (GP/TEV); and, book value-to-market capitalization (B/M). They also compare the performances of ratios calculated with one year of earnings versus averages of annual earnings over the past two to eight years. They include a lag of at least three months between firm reporting interval and return calculation interval. Using stock price and firm fundamentals data for NYSE common stocks with at least eight years of history (excluding financial, utilities and the 10% of stocks with the smallest market capitalizations) during July 1971 through December 2010, they find that:
- Over the entire sample period, equally weighted portfolios of the cheapest 20% of stocks, reformed annually on June 30 based on each of the five valuation ratios, perform as follows:
- High EBITDA/TEV stocks generate the highest average annual gross return of 17.7% and the strongest annual three-factor gross alpha (adjusting for market, size and book-to-market) of 2.9%.
- High FCF/TEV and GP/TEV stocks generate moderate average annual gross returns of 16.6% and 16.5%, respectively, with significant alphas.
- High E/M (earnings yield) and low B/M stocks generate the lowest average annual gross returns of 15.2% and 15.0%, respectively, with no alpha.
- Over the entire sample period, average annual gross returns for equally weighted hedge portfolios that are long (short) the cheapest (most expensive) 20% of stocks range from 9.7% based on EBITDA/TEV to 5.8% based on E/M.
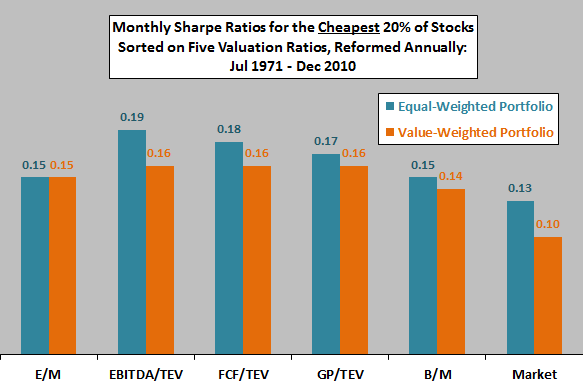
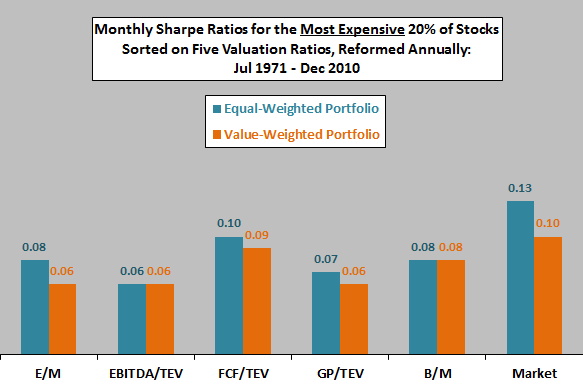
- Adjusting for volatility via Sharpe ratio, cheap EBITDA/TEV stocks and FCF/TEV stocks are relative outperformers (see charts below).
- Ratios based on average earnings over the prior two to eight years add little value to those based on one-year earnings.
The following charts, constructed from data in the paper, compare monthly gross Sharpe ratios equal-weighted and value-weighted portfolios of the cheapest 20% of stocks (upper chart) and the most expensive 20% of stocks (lower chart) based on five valuation ratios over the period July 1971 through December 2010. As noted above, the sample is NYSE stocks, excluding financials, utilities and the smallest 10% of firms. Portfolios are reformed annually at the end of June.
Results indicate that EBITDA/TEV is the best-performing valuation ratio.


In summary, evidence from the last four decades indicates that EBITDA/TEV is the best of five commonly used stock valuation ratios.
The authors provide detailed definitions of all ratio components and calculations of Sortino ratios and worst drawdowns, in addition to Sharpe ratios.
Cautions regarding findings include:
- Return calculations are gross, not net. Including the costs of annual portfolio reformation (which vary considerably over the sample period) would reduce reported returns. For many investors, holding enough stocks for reliable capture of any outperformance would be problematic due to high percentage trading frictions.
- Testing of multiple indicators on the same sample introduces data snooping bias (luck), tending to overstate expectations for the best performers. There may also be second-hand data snooping bias derived from indicator selection based on prior studies (with an unknown number of rejected but unreported poor-performing indicators).
- The sample period is not long, especially for tests involving long-term average earnings (there are only five independent eight-year intervals in the sample).