How do housing, equities and government bonds/bills perform worldwide over the long run? In their February 2018 paper entitled “The Rate of Return on Everything, 1870-2015”, Òscar Jordà, Katharina Knoll, Dmitry Kuvshinov, Moritz Schularick and Alan Taylor address the following questions:
- What is the aggregate real return on investments?
- Is it higher than economic growth rate and, if so, by how much?
- Do asset class returns tend to decline over time?
- Which asset class performs best?
To do so, they compile long-term annual gross returns from market data for housing, equities, government bonds and short-term bills across 16 developed countries (Australia, Belgium, Denmark, Finland, France, Germany, Italy, Japan, the Netherlands, Norway, Portugal, Spain, Sweden, Switzerland, the UK and the U.S.). They decompose housing and equity performances into capital gains, investment incomes (yield) and total returns (sum of the two). For equities, they employ capitalization-weighted indexes to the extent possible. For housing, they model returns based on country-specific benchmark rent-price ratios. Using the specified annual returns for 1870 through 2015, they find that:
- For the risky assets (housing and equities):
- Both have average real annual total gross returns about 7%, but standard deviations are about 10% for housing versus 22% for equities. Gross compound annual real growth rates (CAGR) are 6.6% for housing and 4.6% for equities.
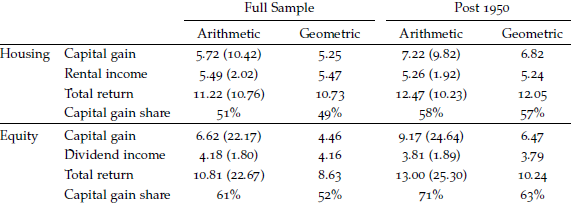
- Housing rental yields and equities dividend yields are roughly stable over time and across countries, comprising roughly half of CAGR (see the first table below).
- Equities exhibit more pronounced global boom-bust cycles than does housing, with real equities gross returns compounded by decade as high as 16% and as low as -4%. World War II coincides with a regime change, with equities returns higher thereafter, but still very volatile and more tied to the business cycle than housing.
- Low correlations between equities and housing returns offer substantial diversification benefits. While equities returns become increasingly correlated across countries over time (especially since World Ware II), housing returns do not.
- Long-run risky asset average real total annual gross returns are roughly 6%-8% per year across countries, with housing winning in six of 16 countries and equities winning in five. Based on real annual gross Sharpe ratios, housing wins in all 16 countries.
- Average investor holding periods and average trading frictions suggest that annualized frictions for housing and equities are similar over the long run.
- For the safe assets (government bonds and bills):
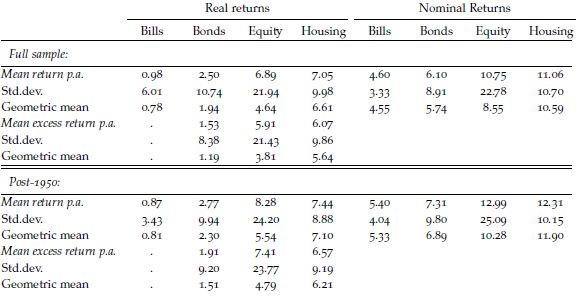
- Gross real returns on safe assets are much lower than those on risky assets, averaging about 2.5% for bonds and 1% for bills (see the second table below), with substantial volatility.
- The real safe rate is highest at the start of the sample, between world wars and during the mid-1980s fight against inflation. Rates are low, even negative, during times of high inflation and the two world wars. The recent long decline in rates is similar to that between 1870 and World War I. Real safe rates arguably fluctuate around current levels.
- Long-term and short-term rates generally track very closely with a 1% average term premium.
- Cross-country real safe returns have consistently positive correlations, with marked increases during World War I and the 1930s.
- Regarding the equity risk premium (ERP):
- Before World War I, ERP is stable at around 5%. It rises slightly after the war before falling to an all-time low near zero by 1930. ERP increases dramatically after World War II to an all-time high around 14% in the 1950s, before falling back to its historical average.
- During most of the sample period, risky and safe asset returns are positively correlated (not mutual hedges). However, the correlation declines over recent decades and turns negative since the 1990s.
- In peacetime, return on wealth is consistently much greater than country economic growth. This gap is currently large, in the range 3%-4%.
The following table, extracted from the paper, summarizes equally weighted average nominal annual gross returns for housing, equities and their components across all 16 countries as available over the full sample period and since 1950. Standard deviations are in parentheses. Results show that housing outperforms equities after risk adjustment and that income streams (rents and dividends) comprise about half of CAGRs.

The next table, also extracted from the paper, summarizes average real and nominal gross annual returns for all four asset classes weighted equally across 16 countries as available over the full sample period. Excess returns are relative to government bills. Geometric mean is CAGR.

In summary, evidence indicates that housing (including rental income) may be the most attractive asset class in developed countries over the long run.
Cautions regarding findings include:
- Samples by country do not have uniform start dates, introducing potential country market survivorship bias.
- The use of equal weighting for aggregation across countries may give undue weight to small economies.
- While the authors take pains to validate their approach, housing returns are modeled and not compiled from actual annual rents and real estate transactions.
- The authors state that quantifying effects of country taxes is beyond the scope of the study.
- The above estimates derive from unlevered housing returns. The authors argue that this approach does not greatly affect findings.
- The authors note that they exclude episodes of hyperinflation, which may be very disruptive to asset returns.
See also: