How do widely studied anomalies relate to representative stocks-bonds portfolio returns (rather than the risk-free rate)? In his March 2017 paper entitled “Understanding Anomalies”, Filip Bekjarovski proposes an approach to asset pricing wherein a representative portfolio of stocks and bonds is the benchmark and stock anomalies are a set of investment opportunities that may enhance the benchmark. He therefore employs benchmark-adjusted returns, rather than excess returns, to determine anomaly significance. Specifically, his benchmark portfolio captures the equity, term and default premiums. He considers 10 potentially enhancing anomalies: size, value, profitability, investment, momentum, idiosyncratic volatility, quality, betting against beta, accruals and net share issuance. He estimates each anomaly premium as returns to a portfolio that is each month long (short) the value-weighted tenth, or decile, of stocks with the highest (lowest) expected returns for that anomaly. He assesses the potential of each anomaly in three ways: (1) alphas from time series regressions that control for equity, term and default premiums; (2) performances during economic recessions; and, (3) crash proneness. He measures the attractiveness of adding anomaly premiums to the benchmark portfolio by comparing Sharpe ratios, Sortino ratios and performances during recessions of five portfolios: (1) a traditional portfolio (TP) that equally weights equity, term and default premiums; (2) an equal weighting of size, value and momentum premiums (SVM) as a basic anomaly portfolio; (3) a factor portfolio (FP) that equally weights all 10 anomaly premiums; (4) a mixed portfolio (MP) that equally weights all 13 premiums; and, (5) a balanced portfolio (BP) that equally weights TP and FP. Using monthly returns for the 13 premiums specified above from a broad sample of U.S. stocks and NBER recession dates during July 1963 through December 2014, he finds that:
- Regarding the individual 10 anomalies:
- Seven generate highly significant alphas relative to the representative benchmark portfolio (not value, profitability or especially size).
- Average loadings on benchmark portfolio assets are small: -0.27 for the equity premium, 0.10 for the term premium and 0.03 for the default premium.
- All have positive average returns during recessions. Except for betting against beta, alphas are not significantly lower during recessions.
- Anomalies that share safe characteristics (profitability, quality, idiosyncratic volatility and size) are somewhat bond-like.
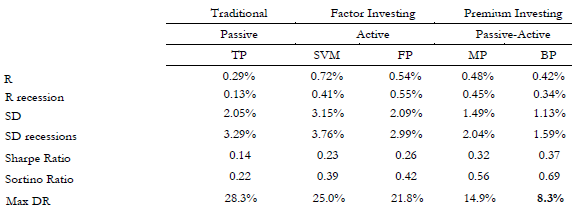
- Portfolios that combine the benchmark portfolio factors and anomaly factors outperform the benchmark portfolio on a gross basis (see the table below). Because of its very low volatility, the BP portfolio has the highest gross monthly Sharpe and Sortino ratios and the smallest maximum drawdown. The passive and active segments of the BP portfolio do not crash at the same time over the entire sample.
- There is no evidence of anomaly alpha decay over the sample period. In fact, the only significant results are increasing profitability and quality alphas.
The following chart, extracted from the paper, compares gross monthly performance statistics for the five portfolio strategies specified above over the full sample period. Results suggest that:
- Multi-anomaly portfolios (SVM and FP) outperform the benchmark portfolio (TP).
- Combining benchmark and anomaly portfolios (MP and BP) outperforms multi-anomaly portfolios (SVM and FP).
- Making equal allocations to the benchmark portfolio and the 10-factor anomaly portfolio (BP) outperforms weighting all 13 factors equally (MP).
- Superiority of BP derives mostly from its low volatility.

In summary, evidence suggests that widely studied stock anomalies are more important for a representative stocks-bonds portfolio than indicated by academic anomaly studies.
Cautions regarding findings include:
- Factor returns are gross, not net. Accounting for costs of monthly factor portfolio reformation and shorting would reduce returns. Also:
- Shorting of all specified stocks may be costly or infeasible due to lack of shares to borrow.
- Factor portfolio turnovers may differ, such that costs may be higher for some factors than others. In other words, gaps between gross and net performance may vary by factor.
- Portfolio returns are also gross. Accounting for monthly costs of rebalancing the factors and/or segments within portfolios to equal weight may be material.
- Data acquisition/processing to maintain factor portfolios is beyond the reach of many investors, who would bear fees for delegating this work to an investment/fund manager.
- Trying different portfolios of factor premiums introduces snooping bias, such that the best-performing portfolio overstates expectations.