“Market Impacts of Growth in Target Date Funds” summarizes research on potential market-wide effects of periodic rebalancing actions of Target Date Funds (TDF), which trade against momentum. One piece of evidence is that monthly autocorrelation of S&P 500 Index returns is significantly negative during 2010-2019 but not during 1986-1995 or 1996-2005. Another is that TDFs accomplish most of quarterly rebalancing within the next quarter. To assess how convincing autocorrelation findings are, we calculate rolling 5-year monthly (60-month) and quarterly (20-calendar quarter) autocorrelations of returns for:
- SPDR S&P 500 ETF Trust (SPY) since January 1993 to represent the U.S. stock market.
- Fidelity Fund (FFIDX) since January 1980 to represent the U.S. stock market
- Fidelity Investment Grade Bond Fund (FBNDX) since January 1980 to represent the U.S. bond market.
Using monthly total (dividend-reinvested) returns for these three assets through October 2020, we find that:
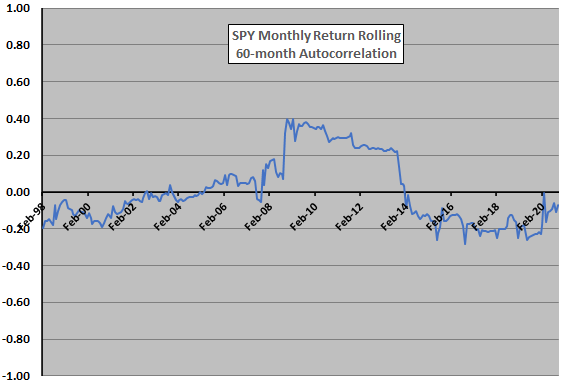
The following chart tracks rolling 60-month autocorrelation of total monthly returns for SPY over the available sample period. If growth in use of TDFs drives results, there should be a somewhat steady, perhaps accelerating, decline in autocorrelation over the sample period.
However, autocorrelation at a monthly frequency is first modestly negative (reverting), then moderately positive (trending) and then modestly negative again (reverting). The 2008 financial crisis may be the trigger for the positive regime. There is no persistent downward trend in autocorrelation as would be expected from growing use of TDFs. On the contrary, the abrupt jumps up and down argue against a gradual cause.
Next, since TDF rebalancing is more a quarterly than a monthly activity, we shift to quarterly returns.

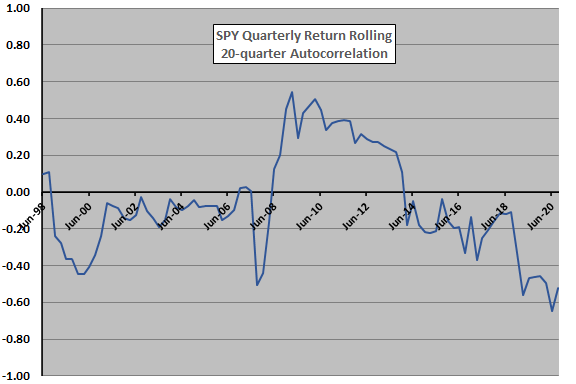
The next chart tracks rolling 20-quarter autocorrelation of total calendar quarter returns for SPY over the available sample period. Results for a quarterly frequency are largely similar to those for the monthly frequency. Steady growth of TDFs do not explain results as well as some kind of regime change triggered by the 2008 financial crisis.
To extend the sample period and to include the bond market in the analysis, we repeat these analyses on FFIDX and FBNDX.

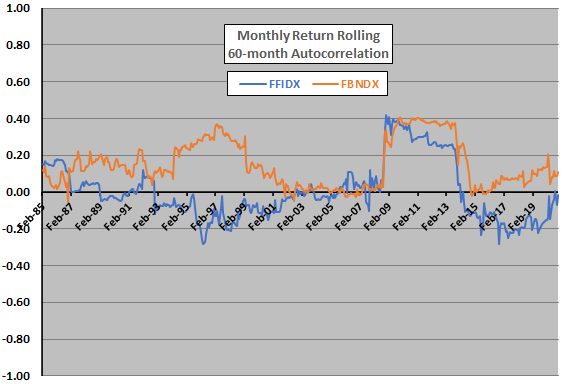
The next chart tracks rolling 60-month autocorrelations of total monthly returns for FFIDX and FBNDX over the available sample period. Again, the 2008 financial crisis appears to trigger unusual stock market behavior and to trigger somewhat unusual similarity in stock and bond market behaviors. Attribution of changes in autocorrelations over time to growth in TDFs seems problematic.
Again, since TDF rebalancing is more a quarterly than a monthly activity, we shift to quarterly returns.

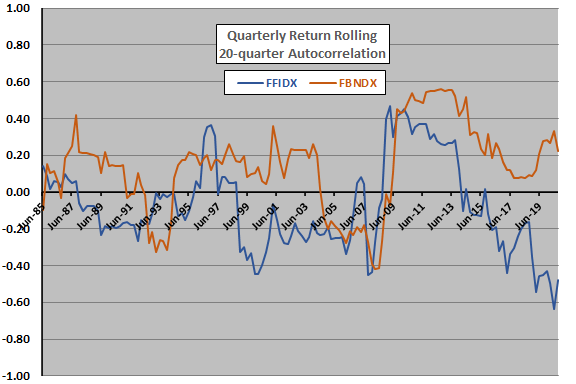
The final chart tracks rolling 20-quarter autocorrelations of total calendar quarter returns for FFIDX and FBNDX over the available sample period. Again, given the variability in autocorrelations over time, attribution of market behaviors to growth in TDFs seems problematic.

In summary, evidence from rolling autocorrelation analyses of SPY, FFIDX and FBNDX raise doubts about the finding that TDF rebalancing is having reliable effects on U.S. stock and bond market behaviors.
Caution regarding finding include:
- Sample periods are not long in terms of independent 5-year intervals. A strong explanation of variability in autocorrelations appears elusive.
- Correlations do not necessarily translate to good investment/trading strategies.