A subscriber asked about an annually rebalanced portfolio of 50% stocks and 50% trend following managed futures as recommended in a 2014 Greyserman and Kaminski book [Trend Following with Managed Futures: The Search for Crisis Alpha], suggesting Equinox Campbell Strategy I (EBSIX) as an accessible managed futures fund. To investigate, we consider not only EBSIX (inception March 2013) but also a longer trend following hedge fund index with monthly returns back to December 1999. This alternative “is an equally weighted index of 37 constituent funds…designed to provide a broad measure of the performance of underlying hedge fund managers who invest with a trend following strategy.” The correlation of monthly returns between this index and EBSIX during April 2013 through February 2019 is 0.84, indicating strong similarity. We use SPDR S&P 500 (SPY) as a proxy for stocks. Using annual returns for EBSIX during 2014-2018 and for the trend following hedge fund index and SPY during 2000-2018, we find that:
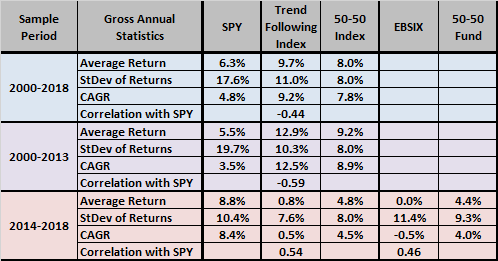
The following table summarizes annual performance statistics for:
- SPY, the trend following hedge fund index and an annually rebalanced portfolio of 50% SPY and 50% index (50-50 Index) during the full sample period (2000-2018), the subperiod prior to availability EBSIX (2000-2013) and the subperiod since availability of EBSIX (2014-2018).
- SPY, EBSIX and an annually rebalanced portfolio of 50% SPY and 50% EBSIX (50-50 Fund) during 2014-2018.
Notable points are:
- Overall, 50-50 Index is attractive because of the strong early performance of the trend following hedge fund index and its negative annual return correlation with SPY.
- However, over the last relatively crisis-free five years both the index and EBSIX perform poorly and have positive correlations with SPY, so the 50-50 Index and 50-50 Fund performances are much less attractive in recent years.
In fact, the managed futures index is strong during 2000-2010 (average annual return 16.5%) and weak during 2011-2018 (average annual return 0.5%). It is possible that the findings in the book derive from a lucky (crisis-rich) streak for trend following, or that the last few years represent an unlucky (crisis-free) streak for trend following, or that the market has adapted to the strong performance of trend following via strategy crowding.
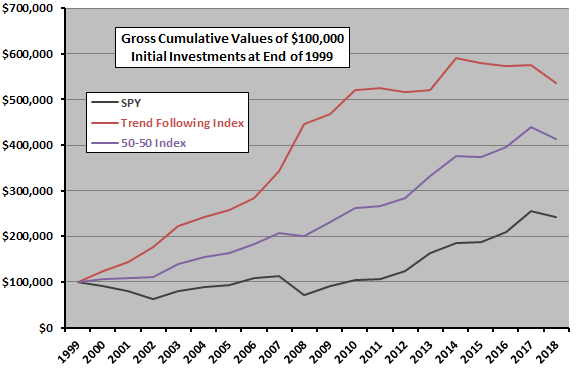
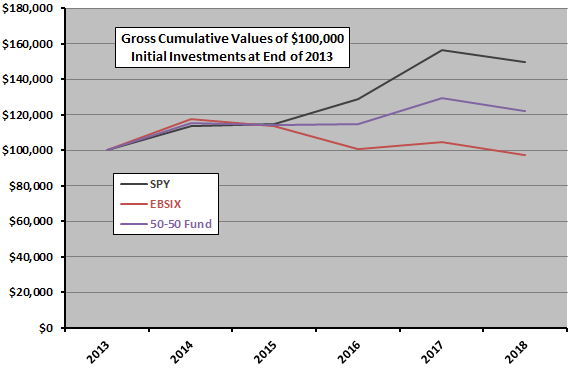
For additional perspective, we look at cumulative returns.

The following two charts track annual performances of SPY, the trend following hedge fund index and 50-50 Index during 2000-2018 (first chart) and for SPY, EBSIX and 50-50 Fund during 2014-2018 (second chart). The first chart confirms that trend following hedge funds are attractive through 2010 (with two deep bear markets for SPY) and much less attractive in the crisis-free subsample since 2010. 50-50 Index exhibits low volatility due to the negative correlation of component return series. The second chart shows that EBSIX is unattractive after its first year.


In summary, evidence indicates that an annually rebalanced portfolio of 50% stocks and 50% trend following managed futures (as proxied by trend following hedge funds) is reasonably attractive over the full sample period, but has recently been weak.
Cautions regarding findings include:
- Sample periods are not long for annual return analyses.
- Results are gross, not net, but annual portfolio rebalancing costs are low.
- As indicated, performance of the trend following hedge fund index compared to SPY depends on the number/depth of equity bear markets in the sample.
- The hedge fund index used may be an imperfect proxy for trend following managed futures.