Are buy-and-hold stock market returns attractive over the long run globally? In their May 2020 paper entitled “Stocks for the Long Run? Evidence from a Broad Sample of Developed Markets”, Aizhan Anarkulova, Scott Cederburg and Michael O’Doherty apply a stationary block bootstrap procedure (retaining some time series features) to generate distributions of 1,000,000 each 1-month to 30-year real returns across global equity markets. They mitigate survivorship and easy data biases via broad coverage of developed countries and inclusion of market interruptions. They focus on a long-term (30-year) investment horizon, with returns accumulated in local currencies. Using monthly total (dividend-reinvested) equity index returns and consumer price indexes for 39 developed countries as available according to certain criteria during January 1841 through December 2019, they find that:
- The arithmetic (geometric) mean monthly gross real total return of the pooled sample is 0.55% (0.37%), compared to 0.62% (0.50%) for the U.S. sample.
- For a 30-year investment horizon:
- Average gross real terminal value of $1.00 initial investments for the pooled (U.S.) sample is $7.34 ($8.03), with standard deviation $13.68 ($7.09). U.S. performance is much more reliable than the pooled sample.
- Average gross real terminal values of $1.00 initial investments for the pooled (U.S.) sample at the 5th and 10th percentiles of performance are $0.47 and $0.85 ($1.71 and $2.29), respectively.
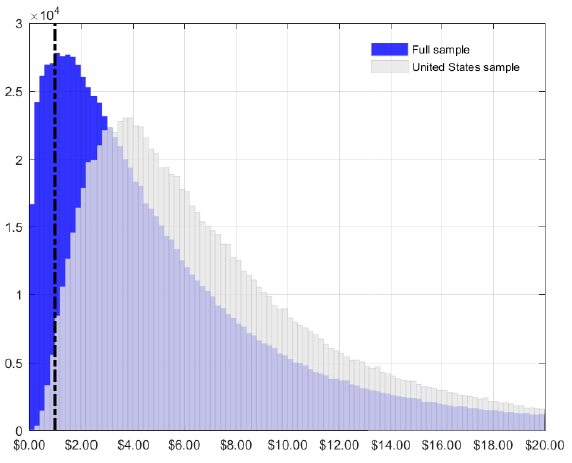
- For the pooled sample, there is a 12.1% chance that a buy-and-hold investor will lose relative to inflation (see the chart below).
- Findings are robust to: varying the start year of the sample; excluding countries with relatively small populations; excluding countries with low ratios of market capitalization to gross domestic product; and, varying the bootstrap procedure parameters.
- A mean-variance investor using the pooled sample of historical returns to optimize allocations between the stock market and a risk-free asset would make considerably lower stock allocations than an investor relying on the U.S. sample to predict equity return.
The following chart, taken from the paper, compares distributions of real gross terminal values of $1.00 dollar initial investments after 30 years across 1,000,000 bootstrap simulations for the pooled sample of all developed countries (blue) and the U.S. sample (gray). The dashed line indicates terminal value $1.00, separating real losses and real gains. Both distributions have long right tails, indicating high probabilities of achieving a substantial gain. The distributions also have similar means, $7.34 for the pooled sample and $8.13 for the U.S. sample. The left tails, however, are very different, with the pooled sample having a much higher probability of real loss than the U.S. sample.

In summary, evidence indicates that stocks are much riskier globally than indicated by U.S. data.
Cautions regarding findings include:
- As noted in the paper, returns are gross, not net. Accounting for costs of maintaining portfolios that track country stock markets (such as mutual funds) would reduce returns. These costs may vary considerably by country and over time.
- There may be other market/economic/political fundamentals that help some country markets perform better than others besides the ratio of market capitalization to gross domestic product.