Two major theories of asset pricing include: one based on asset risk (the market compensates inherent riskiness); and, another based on asset illiquidity (the market compensates illiquidity). In his July 2018 paper entitled “Illiquidity and Stock Returns: A Revisit”, Yakov Amihud presents cross-sectional and time series analyses of illiquidity and U.S. stock returns that extend the 1964-1997 sample period of his seminal illiquidity research. Specifically, he:
- Each year, sorts stocks by volatility (standard deviation of daily returns for the 12 months ending November) into three groups.
- Each year, sorts stocks within each volatility group into five illiquidity sub-groups, with illiquidity specified as the 12-month average of absolute daily return divided by same-day dollar volume traded over the same 12 months.
- Each month during the subsequent January through December, calculates the monthly return of each of the resulting 15 portfolios, weighting stocks based on their market capitalization weights at the end of the prior month.
- Each month, calculates an illiquid-minus-liquid factor (IML) as average return of the most illiquid portfolios across volatility groups minus average return of the least illiquid portfolios across volatility groups.
This process controls for interaction between volatility and illiquidity. He segments findings into replicating Period I (1964-1997) and new Period II (1998-2017). He screens source stocks by requiring for each year: price between $5 and $1000; over 200 days of valid returns and volumes; and, not in the top 1% of illiquidities (outliers). Using data for NYSE/AMEX common stocks that meet these criteria during 1964 through 2017, he finds that:
- IML weakens in recent data. Average IML is 0.64% (0.43%) for Period I (II), with 60.5% (56.7%) of months positive.
- 4-factor model (market, size, book-to-market, momentum) alphas for IML are 0.37% for Period I and 0.40% Period II. IML relates negatively to the market factor, positively and strongly to the size factor and positively to the value factor.
- In Period I (II), there is a positive but insignificant (negative and significant) January effect. In other words, the positive illiquidity premium is confined to February through December in recent years.
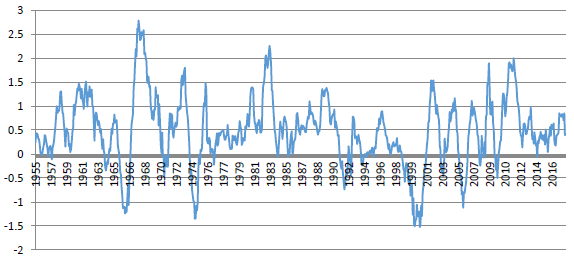
- One-month-ahead (out-of-sample) estimates of IML alpha is 0.52% for Period I and 0.33% for Period II (see the chart below). Out-of-sample January alphas are positive in Period I and strongly negative in Period II.
The following chart, taken from the paper, tracks the 12-month simple moving average of monthly one-month-ahead IML alpha (percentages). The series is mostly positive. Its most negative value is in 2000.

In summary, evidence continues to support propositions that: (1) illiquidity is priced with a mostly positive premium; and, (2) this premium varies over time.
Cautions regarding findings include:
- Findings are gross, not net. Accounting for monthly portfolio reformation frictions and shorting costs would affect findings. Shorting may not always be feasible as specified.
- In fact, illiquidity is closely related to trading frictions, confounding exploitation of the liquidity premium.
For related research see these search results.