How differently does the “Simple Asset Class ETF Value Strategy” (SACEVS) perform when the U.S. stock market rises and falls? This strategy seeks to exploit relative valuation of the term risk premium, the credit (default) risk premium and the equity risk premium via exchange-traded funds (ETF). To investigate, because the sample period available for mutual funds is much longer than that available for ETFs, we use instead data from “SACEVS Applied to Mutual Funds”. Specifically, each month we reform a Best Value portfolio (picking the asset associated with the most undervalued premium, or cash if no premiums are undervalued) and a Weighted portfolio (weighting assets associated with all undervalued premiums according to degree of undervaluation, or cash if no premiums are undervalued) using the following four assets:
- Monthly average 3-Month Treasury Bill (T-bill) Secondary Market Rate as an approximation of the return on Cash.
- Vanguard GNMA Investor Shares (VFIIX).
- Vanguard Long-Term Investment Grade Investor Shares (VWESX).
- Vanguard US Growth Investor Shares (VWUSX).
The benchmark is a monthly rebalanced portfolio of 60% stocks and 40% U.S. Treasuries (60-40 VWUSX-VFIIX). We say that stocks rise (fall) during a month when the return for VWUSX is positive (negative) during the SACEVS holding month. Using monthly risk premium estimates, SR and LR, and Best Value and Weighted returns during June 1980 through June 2017 (444 months), we find that:
Over the available sample period, VWUSX rises (falls) during 264 (181) months.
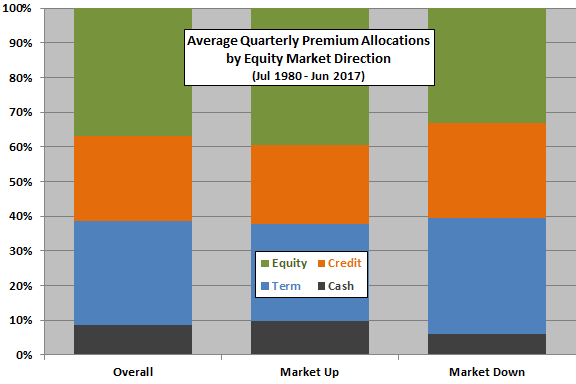
The following chart summarizes average monthly premium allocations (determined at the end of the prior month) overall and when VWUSX rises (Market Up) and falls (Market Down) over the available sample period. An investor would not know whether equities will rise or fall for a month when setting the allocation for that month. Results suggest that SACEVS tends to allocate more (less) to the equity premium and less (more) to the term and credit premiums just before stocks rise (fall).
How do these findings about allocations translate to strategy performance?

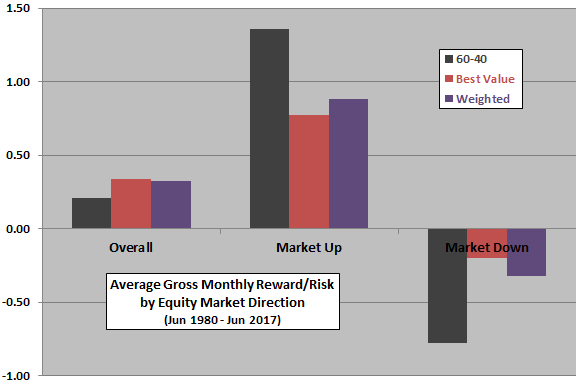
The next chart summarizes average gross monthly reward-risk ratios (average monthly return divided by standard deviation of monthly returns) overall and when VWUSX rises and falls over the available sample period. Calculations ignore portfolio reformation/rebalancing costs and tax implications of trading. Gross results suggest that, on an average risk-adjusted basis:
- The 60-40 benchmark beats SACEVS Best Value and Weighted when stocks rise.
- SACEVS beats the 60-40 benchmark when stocks fall.
An investor who could predict the direction of the U.S. stock market would prefer the 60-40 benchmark when stocks rise and SACEVS Best Value or Weighted when stocks fall.
SACEVS underperformance when stocks rise derives from both a lower average monthly return and a higher monthly return volatility. SACEVS outperformance when stocks fall derives from both a higher average monthly return and a lower monthly return volatility.

In summary, evidence from available data suggests that SACEVS works in part by avoiding much of negative stock market returns.
Cautions regarding findings include:
- Variables used to measure risk premiums in “SACEVS Applied to Mutual Funds” are somewhat different from those used in SACEVS as tracked.
- Per “SACEVS Applied to Mutual Funds”, strategy performance is sensitive to the lookback interval used to determine risk premium overvaluation/undervaluation.
- As noted, the above analyses ignore trading frictions. There may be none within a family of mutual funds.
- Other ways of measuring equity market direction may produce different findings.
- Other cautions in “SACEVS Applied to Mutual Funds” apply.