Which equity markets worldwide offer the best reward-to-risk ratios? In their October 2012 paper entitled “Risk-Adjusted Performances of World Equity Indices”, Yigit Atilgan and Ozgur Demirtas investigate whether 52 developed and emerging market equity indexes compensate investors equally based on reward-to-risk ratios. They consider three reward-to-risk ratios: (1) conventional Sharpe ratio based on monthly return and standard deviation of daily returns over the past 100 trading days; (2) Sharpe ratio substituting non-parametric value at risk (VAR) (magnitude of minimum daily return over past 100 trading days) for standard deviation of returns; and, (3) Sharpe ratio substituting parametric VAR (accounting for return distribution skewness and kurtosis) for standard deviation of returns. The latter two variations of the Sharpe ratio emphasize downside risk and return distribution non-normalities. Using daily returns and monthly total returns in local currencies for 28 developed and 24 emerging market value-weighted indexes, and associated risk-free rates, during January 1973 through December 2011 (38 years), they find that:
- The top five average monthly developed (emerging) market index returns range from 1.13% to 1.50% (2.19% to 4.50%), but four of the top five emerging markets also have the highest standard deviations of monthly returns. The maximum monthly drawdown is greater than 30% for 3 (14) developed (emerging) market indexes. In general, index return distributions exhibit modest skewness (asymmetry) but substantial kurtosis (fat tails).
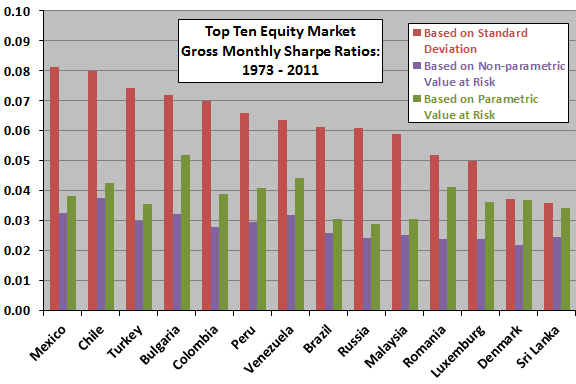
- For the three reward-to-risk ratios (see the chart below):
- Based on conventional Sharpe ratio, 12 (11) of 13 countries in the top (bottom) quartile are emerging (developed) markets.
- Based on Sharpe ratio calculated with nonparametric VAR, 13 (10) of 13 countries in the top (bottom) quartile are emerging (developed) markets.
- Based on Sharpe ratio calculated with parametric VAR, 11 (9) of 13 countries in the top (bottom) quartile are emerging (developed) markets.
- On a pooled basis, all three reward-to-risk ratios are significantly higher for emerging markets than developed markets.
- Since the 2008 financial crisis, reward-to-risk ratios decline in both developed and emerging markets, but emerging markets continue to outperform developed markets, and the outperformance is more pronounced.
The following chart, constructed from data in the paper, summarizes the risk-adjusted performance of country equity indexes in the top ten based on any of the three risk-adjusted performance measures. A total of 14 markets (ordered by conventional Sharpe ratio) captures all three top tens. Emerging markets dominate the top ten by any of the three measures.

In summary, evidence indicates that emerging market equity indexes offer robustly better risk-adjusted returns than developed market equity market indexes.
Cautions regarding findings include:
- Indexes are not tradable. Including the costs (trading frictions and management fees) of creating and maintaining funds to track country equity indexes would reduce reported returns. These frictions may vary materially by country such that net rankings differ from gross rankings. In fact, the stated purpose of the study argues for use of net returns from tradable assets.
- Since country political/economic environments may change dramatically over the sample period, it would be useful to estimate the trends in risk-adjusted returns by country over the sample period.