Does implied stock market volatility (IV) predict stock market returns? In their March 2018 paper entitled “Implied Volatility Measures As Indicators of Future Market Returns”, Roberto Bandelli and Wenye Wang analyze the relationship between S&P 500 Index IV and future S&P 500 Index returns. They consider volatilities implied either by S&P 500 Index options (VIX) or by 30-day at-the-money S&P 500 Index straddles. Specifically, they each day:
- Rank current S&P 500 Index IV according to ranked tenth (decile) of its daily distribution over the past two years. If current IV is higher than any value of IV over the past two years, its rank is 11.
- Calculate S&P 500 Index returns over the next one, five and 20 trading days.
- Relate these returns to IV rank.
They calculate statistical significance based on the difference between the average IV-ranked log returns and log returns over all intervals of the same length. Using daily data for the selected variables during December 1991 through November 2017, they find that:
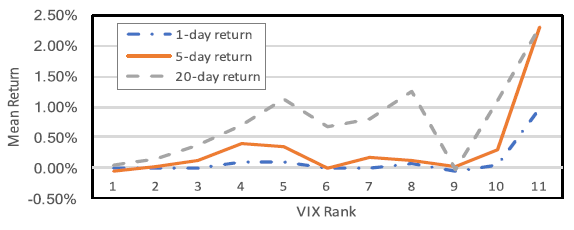
- IV relates positively to S&P 500 Index returns at horizons of one, five and 20 trading days. However, the effect concentrates in IV rank 11 (see the chart below), which comprises less than 1% of daily observations.
- Findings are statistically significant for 1-day and 5-day return horizons when using the VIX as the IV metric, but associated returns are economically small.
The following chart, taken from the paper, summarizes 1-day, 5-day, 20-day average S&P 500 Index returns by VIX rank over the full sample period. Results suggest an exploitable effect for VIX rank 11 (2-year VIX high).

In summary, evidence indicates that S&P 500 Index returns are unusually high in the short term after extreme VIX spikes.
Cautions regarding findings include:
- Analyses for 5-day and 20-day returns apparently use overlapping return intervals, thereby introducing large return series autocorrelations which would overstate statistical significance if IV ranks cluster in the time series.
- A related point is that the study does not include a portfolio-level analysis outlining a times series method of exploiting findings (unambiguous entry and exit points, with trading frictions).
- As noted, rank 11 (2-year VIX highs) opportunities are rare (54 out of about 6,000 observations).
- If these rare opportunities cluster, investors cannot exploit them independently.
- Findings may be sensitive to parameter settings, such as the 2-year lookback interval used to assign current IV rank. However, the authors report that findings are not materially different for a 1-year lookback interval.
See also “Stock Market Performance Around VIX Peaks” and “VIX and Future Stock Market Returns”.