Do extreme equity market valuations represent opportunities in value stocks? In their October 2020 paper entitled “Extrapolators at the Gate: Market-wide Misvaluation and the Value Premium”, Stefano Cassella, Zhaojing Chen, Huseyin Gulen and Ralitsa Petkova test the hypothesis that extrapolating (momentum) investors bid up growth stocks in good times and bid down value stocks in bad times, such that the value premium concentrates during reversion from these conditions. Their principal measure of market valuation is average book value-to-market capitalization ratio (B/M) of all firms, excluding financial stocks, utility stocks and stocks priced ice less than $1. When monthly B/M is in the top (bottom) 10% of monthly values for the past 10 years, they deem the market overvalued (undervalued). For robustness, they consider other percentage cutoffs and an alternative metric that quantifies the distance between the current-month distribution of firm B/Ms and the distributions of over the past 10 years based on the Mann-Whitney U test. They further tie findings to investor expectations based on a long times series constructed from Gallup, American Association of Individual Investors and Investor Intelligence surveys of investors. Using monthly returns and accounting data for U.S. common stocks and the specified survey data during January 1962 through December 2018, they find that:
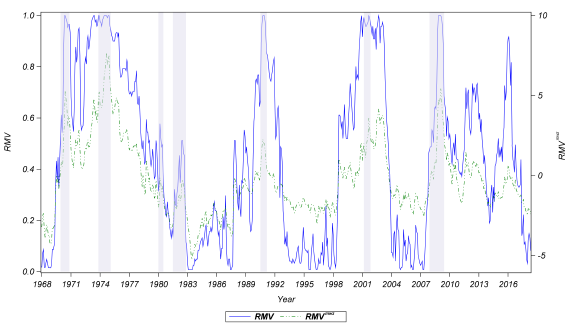
- There are multiple episodes of market overvaluation and undervaluation over the sample period, with the latter often corresponding to economic recessions (see the chart below).
- For a monthly holding interval, after months when average firm B/M is:
- In the top 10% of historical monthly B/Ms (market is undervalued), equal-weighted average gross next-month value premium is 3.42%.
- In the bottom 10% of historical monthly B/Ms (market is overvalued), equal-weighted average gross next-month value premium is 1.70% per month.
- Between these two extremes, equal-weighted average gross next-month value premium is zero.
- For an annual holding interval, after months when average firm B/M is:
- In the top 10% of historical monthly B/Ms (market is undervalued), equal-weighted average gross monthly value premium over the next year is 2.80%.
- In the bottom 10% of historical monthly B/Ms (market is overvalued), equal-weighted average gross monthly value premium over the next year is 1.22% per month.
- Between these two extremes, equal-weighted average gross monthly value premium over the next year is 0.60%.
- Results for the alternative valuation measurement are qualitatively similar with smaller magnitudes.
- After extreme market undervaluation (overvaluation), value strategy gross profitability comes mostly from being long value stocks (short growth stocks). For example, for an annual holding interval:
- After market undervaluation, 1.94% of the 2.80% average gross monthly value premium over the next year comes from outperformance of value stocks and 0.86% comes from underperformance of growth stocks.
- After market overvaluation, 0.39% of the 1.22% average gross monthly value premium over the next year comes from outperformance of value stocks relative and 0.83% comes from underperformance of growth stocks.
- During the year after times when surveys indicate investor expectations in the bottom (top) 10% of historical expectations, average gross monthly value premium over the next year is 3.4% (1.5%).
The following chart, taken from the paper, plots the time series of relative market valuation based on:
- Average historical B/M (RMV, solid blue line measured on the left vertical axis).
- Mann-Whitney U test (RMVmwz, dotted green line measured on the right vertical axis).
The chart also shows NBER recessions in gray shading. Notable points are:
- Extreme valuations tend to cluster, and there are not many such clusters. These features confound precise exploitation.
- Economic recessions tend to coincide with market undervaluation, but undervaluation can occur outside recessions. This result suggests that market valuation offers information about returns independent of the business cycle.

In summary, evidence indicates that the value premium concentrates during times of extreme market misvaluation (long value stocks after extreme market undervaluation and short growth stocks after market overvaluation).
Cautions regarding findings include:
- Reported returns are gross, not net. Accounting for frictions from monthly or annual portfolio reformation and shorting costs would reduce the value premium. Use of equal weighting to calculate the premium exacerbates this caution since small stocks, which are typically more costly to trade and short, contribute to the premium disproportionately to their market capitalizations (capacities).
- Combining a monthly valuation measurement with an annual holding interval translates to overlapping portfolios, which may distort statistics.
- Because the value premium is not strong most of the time during the sample period, a “value” investor may perform poorly for long periods.
- Methodologies described are beyond the reach of most investors, who would bear fees for delegating to a fund manager.
See also “Value Investing Dead?”, “Value Investing Still on Death Row?” and “Value Investing Not Dead?”.