Most stock data sources present Total Return (TR), 100% reinvestment of dividends with no participation in firm rights issuances and share issuances/repurchases, as representative of investment performance. An alternative perspective is Total Return for All Shareholders (TRAS), the return for an investor who maintains a constant fraction of issued shares (see the table below). Can these two measures of returns to investors differ materially? In his May 2020 paper entitled “Total Return (TR) and Total Return for All Shareholders (TRAS). Difference for the Companies in the S&P 100”, Pablo Fernandez compares recent TR and TRAS for stocks in the S&P 100 as of April 2020 that have histories back to the end of 2004 (88 stocks). Using price, dividend, rights issuance and share issuance/repurchase data during December 2004 through April 2020, he finds that:
- On average across stocks, annual TRAS is greater than TR by 0.3%, with TRAS minus TR ranging from 10.5% to -3.9% per year.
- For 19 of 88 companies, TRAS exceeds TR more than 1% per year.
- For 18 of 88 companies, TR exceeds TRAS by more than 1% per year.
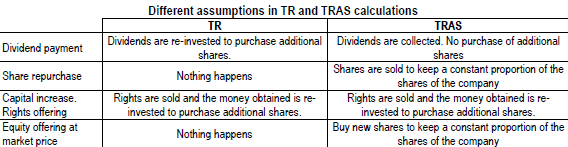
The following table, taken from the paper, summarizes differences between TR and TRAS in terms of investor behaviors.
In summary, investor return metrics differ, and an investor’s approach to equity position maintenance determines which return metric is appropriate.
For a view at the market level over a longer sample period, see “Stock Market Performance Perspectives”.