A subscriber asked about a strategy that switches between an equal-weighted portfolio of Invesco QQQ Trust (QQQ) and iShares Russell 2000 ETF (IWM) when the S&P 500 Index is above its 200-day simple moving average (SMA200) and an equal-weighted portfolio of SPDR Gold Shares (GLD) and iShares 20+ Year Treasury Bond ETF (TLT) when below. Also, more generally, is an equal-weighted portfolio of GLD and TLT (GLD:TLT) superior to TLT only for risk-off conditions? To investigate, we (1) backtest the switching strategy and (2) compare performances of GLD:TLT versus TLT when the S&P 500 Index is below its SMA200. We consider both gross and net performance, with the latter accounting for 0.1% portfolio switching frictions 0.001% daily portfolio rebalancing frictions (rebalancing one hundredth of portfolio value). As benchmarks, we consider buying and holding SPDR S&P 500 ETF Trust (SPY) and a strategy that holds SPY (TLT) when the S&P 500 Index is above (below) its SMA200. Using daily S&P 500 Index levels starting February 5, 2004 and daily dividend-adjusted levels of QQQ, IWM, GLD, TLT and SPY starting November 18, 2004 (limited by inception of GLD), all through November 25, 2020, we find that:
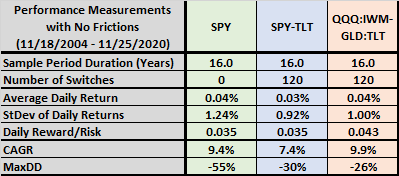
The following table summarizes gross (no frictions) daily performance statistics over the full sample period, including number of risk-on/risk-off switches, average daily return, standard deviation of daily returns, daily reward/risk (average return divided by standard deviation), compound annual growth rate (CAGR) and maximum drawdown (MaxDD), for:
- SPY – buying and holding SPY.
- SPY-TLT – holds SPY (TLT) when the S&P 500 Index is above (below) its SMA200.
- QQQ:IWM-GLD:TLT – the risk-on/risk-off switching strategy specified above.
Based on all metrics, QQQ:IWM-GLD:TLT is preferable to both benchmarks.
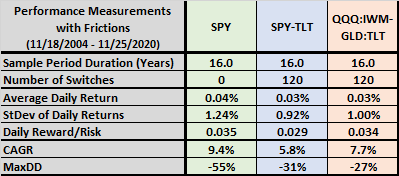
What happens when we incorporate switching and rebalancing frictions.
The next table summarizes daily performance statistics with frictions. Buying and holding SPY is preferable based on average return and CAGR, while QQQ:IWM-GLD:TLT is preferable based on MaxDD.
Net strategy performance is sensitive to assumed levels of frictions. For example, doubling daily rebalancing friction to 0.002% reduces QQQ:IWM-GLD:TLT to 7.2%. Doubling frictions based on SMA200 switching reduces SPY-TLT and QQQ:IWM-GLD:TLT CAGRs to 4.2% and 6.1%, respectively.
For perspective, we look at annual returns and cumulative performances.
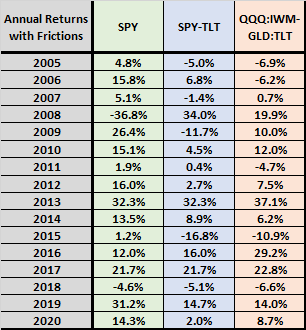
The next table summarizes calendar year returns with baseline frictions (2020 partial through 11/25). The relative performance of QQQ:IWM-GLD:TLT is not consistent by year.
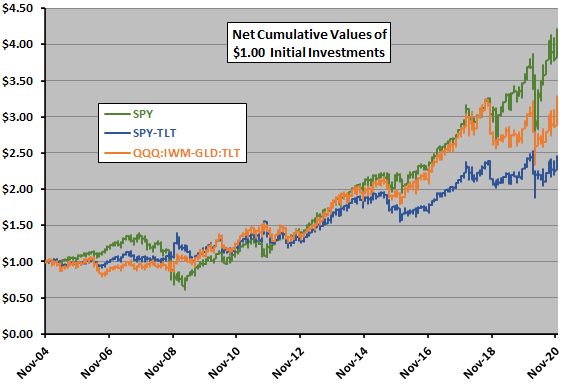
The following chart tracks cumulative values of $1.00 initial investments in each strategy with frictions, reinforcing the finding of inconsistency in QQQ:IWM-GLD:TLT relative performance.
Is GLD:TLT generally superior to TLT alone when the equity market is stressed?
The following table summarizes GLD:TLT and TLT daily return statistics when the S&P 500 Index is below its SMA200 over the full sample period with no frictions. Results suggest that GLD:TLT may be superior to TLT alone for this definition of equity market stress, depending on assumed level of daily rebalancing frictions.
For all days in the sample, the return correlation for GLD and TLT is 0.14. When the S&P 500 Index is below its SMA200, the correlation is 0.12. These low correlations confirm mutual diversification value (at the cost of daily rebalancing frictions).
Is this finding consistent over time?

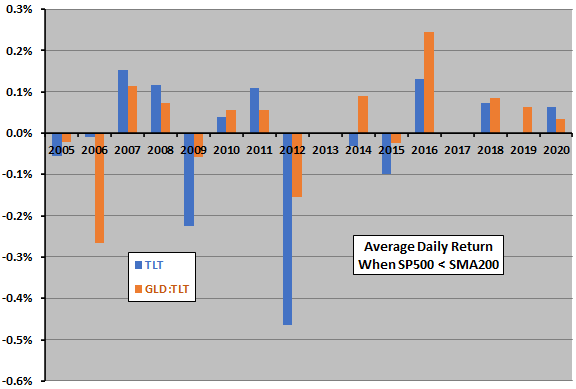
The final chart summarizes GLD:TLT and TLT average daily returns by year when the S&P 500 Index is below its SMA200 with no frictions (2020 partial through 11/25). Results indicate that outperformance of GLD:TLT is somewhat consistent on a gross basis, winning 9 of 14 years containing bear market conditions. However, years that are close may flip after accounting for daily rebalancing frictions.
In summary, evidence suggests that the QQQ:IWM-GLD:TLT strategy may have value for investors who can achieve very low levels of trading frictions.
Cautions regarding findings include:
- The sample period is short for reliable inference about annual performance.
- Assumed levels of switching and rebalancing frictions are more likely too low than too high for most investors.
- Daily rebalancing may not be necessary to achieve most QQQ:IWM-GLD:TLT benefits.
- Some specification of risk-on/risk-off other than S&P 500 Index SMA200 crosses may change findings.
- Testing multiple asset choices in the same model introduces data snooping bias, such that the best-performing choice overstates expectations (incorporates luck). This caution becomes acute when the modeler selecting assets is familiar with their past performance.
See also “Best Safe Haven ETF?”.