Is the Office of Financial Research Financial Stress Index (OFR FSI), described in “The OFR Financial Stress Index”, useful as a U.S. stock market return predictor? OFR FSI is a daily snapshot of global financial market stress, distilling more than 30 indicators via a dynamic weighting scheme. The index drops and adds indicators over time as some become obsolete and new ones become available. Unlike some other financial stress indicators, past OFR FSI series values do not change due to any periodic renormalization and are therefore suitable for backtesting. To investigate OFR FSI power to predict U.S. stock market returns, we relate level of and change in OFR FSI to SPDR S&P 500 (SPY) returns. Using daily and monthly values of OFR FSI and SPY total returns during January 2000 (OFR FSI inception) through June 2019, we find that:
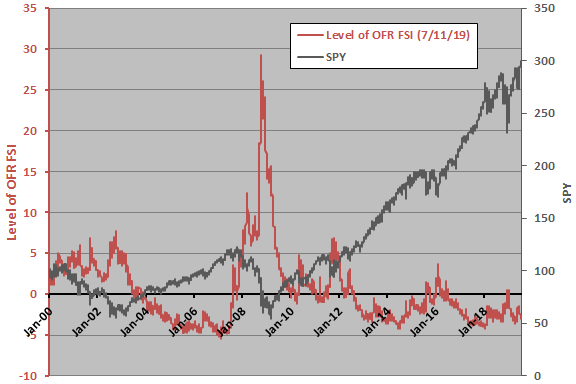
The following chart tracks daily OFR FSI and SPY over the available sample period. It appears the two series relate negatively, but visual inspection does not reveal whether one series leads the other.
For precision, we look at lead-lag correlations.
The following two charts summarize lead-lag relationships between level of OFR FSI and SPY return and between change in OFR FSI and SPY return at daily and monthly frequencies over the full sample period.
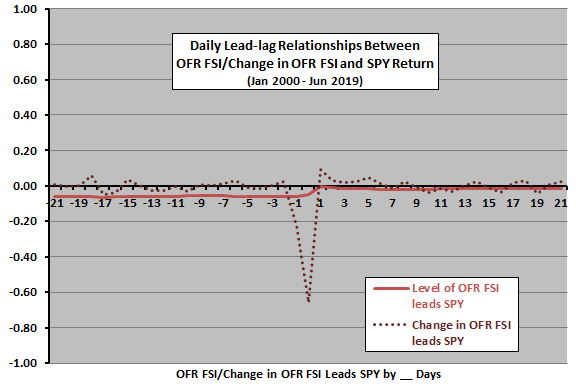
The first chart shows correlations for daily relationships ranging from SPY return leads OFR FSI measurements by 21 trading days (-21) to OFR FSI measurements lead SPY return by 21 trading days (21). Notable points are:
- SPY return very weakly leads level of OFR FSI by 1 to 21 days with a negative relationship (stock market declines increase market risk). The effect appears to be long-term.
- There is a strong negative coincident (0) relationship between SPY return and change in OFR FSI, likely because the former is an input to the stress index.
- Level of OFR FSI does not predict daily SPY returns. There is a very weak positive relationship between change in OFR FSI and next-day SPY return, which could be noise or a stock market reversion effect.
The next chart shows correlations for monthly relationships ranging from SPY return leads OFR FSI measurements by 12 months (-12) to OFR FSI measurements lead SPY return by 12 months (12). Notable points are:
- SPY return leads level of OFR FSI by up to 12 months with a negative relationship (stock market declines increase market risk).
- Level of OFR FSI has negative relationships with SPY returns over the next few months.
- Relationships between change in OFR FSI and future monthly SPY returns are erratic.
The rest of the analysis focuses on monthly relationships between level of OFR FSI and next-month SPY return, which appear to be most reliable.
Correlations discover linear effects. In case there is an important non-linearity in the relationship, we look at average future SPY return by range of monthly OFR FSI.

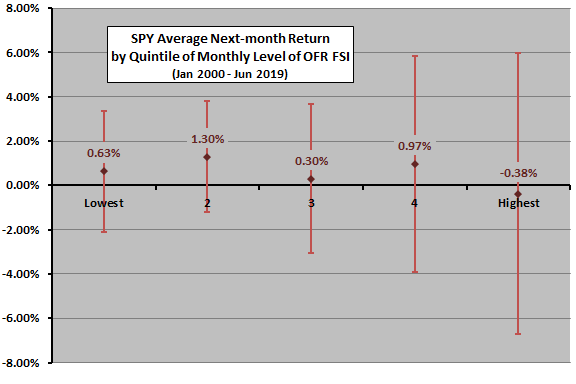
The next chart summarizes average next-month SPY return, along with one standard deviation variability ranges, by ranked fifth (quintile) of monthly OFR FSI. Results indicate that moving out of SPY after high levels of OFR FSI avoids low returns and high volatility. However, average returns do not vary systematically across OFR FSI quintiles, and this analysis is in-sample. An investor operating in real time during the sample period could not generate it.
For greater realism, we try a logical SPY timing strategy that exploits level of OFR FSI.
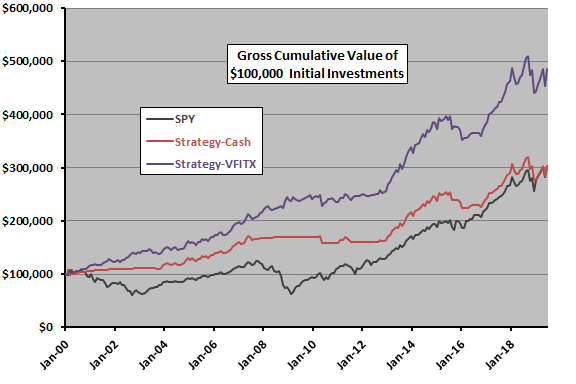
The last two charts track cumulative values of three strategies over the full sample period and, since the full period represents a lucky start for SPY timing strategies, a subperiod since January 2009. The strategies are:
- SPY – buy and hold SPY.
- Strategy-Cash – hold SPY (cash as proxied by 3-month U.S. Treasury bills) when OFR FSI at the end of the prior month is negative or zero (positive).
- Strategy-VFITX – hold SPY (Vanguard Intermediate-Term Treasury Fund Investor Shares, VFITX) when OFR FSI at the end of the prior month is negative or zero (positive).
We ignore switching frictions for the timing strategies (they do not switch often), and we ignore tax implications of switching.
Over the full sample period, the timing strategies are in SPY 57% of months. Strategy 3 easily outperforms SPY. Compound annual growth rates (CAGR) are 5.9%, 5.9% and 8.5% for strategies 1, 2 and 3, respectively. Maximum drawdowns (MaxDD) are -51%, -14% and -14%.
Since January 2009 (an unlucky start for timing), the timing strategies are in SPY 68% of months. The timing strategies dramatically underperform SPY. CAGRs are 15.2%, 5.8% and 7.0% for strategies 1, 2 and 3, respectively. MaxDDs are -16%, -14% and -14%.
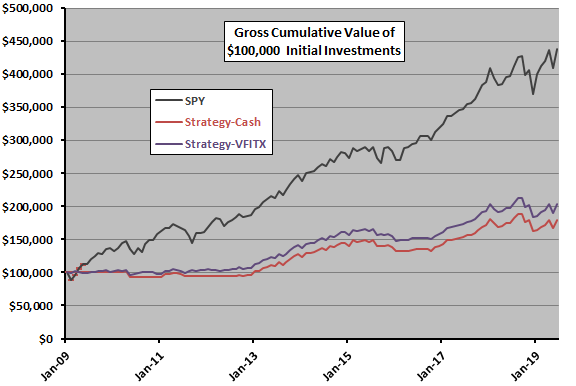
The following tables summarize gross performance statistics for the preceding two charts.
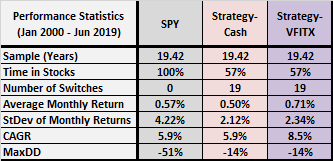
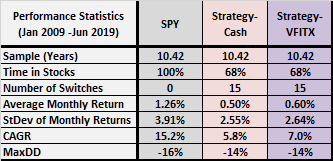
In summary, available evidence indicates that a monthly U.S. stock market timing strategy based on prior-month OFR FSI avoids volatility and drawdowns, but may sacrifice CAGR for extended periods.
Cautions regarding findings include:
- As noted timing strategy results are gross, not net. Accounting for costs of switching out of and into SPY would slightly reduce performance.
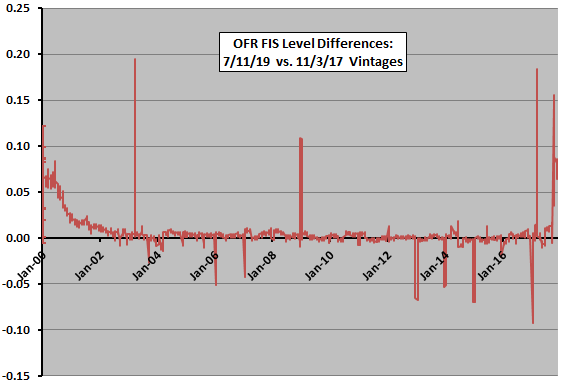
- The referenced paper emphasizes: “The OFR FSI’s value on a given day depends only on information available that day and, once estimated, its value does not change.” However, the following chart records daily differences (recent minus old) between two vintages of the series. This instability in vintages undermines use of any particular vintage for backtesting.
- Using VFITX instead of cash to avoid market stress may not work as well in sample periods with rising, rather than falling, interest rates.
- As noted, there is no theoretical basis for choosing any particular OFR as a SPY timing signal. Some inception-to-date estimate might improve on the naive threshold of zero, but brute force experimentation introduces data snooping bias, such that best results overstate expectations.