Should investors rely on aggregate positions of speculators (large non-commercial traders) as indicators of expected futures market returns? In their November 2018 paper entitled “Speculative Pressure”, John Hua Fan, Adrian Fernandez-Perez, Ana-Maria Fuertes and Joëlle Miffre investigate speculative pressure (net positions of speculators) as a predictor of futures contract prices across four asset classes (commodity, currency, equity index and interest rates/fixed income) both separately and for a multi-class portfolio. They measure speculative pressure as end-of-month net positions of speculators relative to their average weekly net positions over the past year. Positive (negative) speculative pressure indicates backwardation (contango), with speculators net long (short) and futures prices expected to rise (fall) as maturity approaches. They measure expected returns via portfolios that systematically buy (sell) futures with net positive (negative) speculative pressure. They compare speculative pressure strategy performance to those for momentum (average daily futures return over the past year), value (futures price relative to its price 4.5 to 5.5 years ago) and carry (roll yield, difference in log prices of nearest and second nearest contracts). Using open interests of large non-commercial traders from CFTC weekly legacy Commitments of Traders (COT) reports for 84 futures contracts series (43 commodities, 11 currencies, 19 equity indexes and 11 interest rates/fixed income) from the end of September 1992 through most of May 2018, along with contemporaneous Friday futures settlement prices, they find that:
- On average, speculative pressure is 0.19, 0.15, 0.09 and 0.04 for commodities, currencies, equity indexes and interest rates/fixed income, respectively (futures markets tend to be in backwardation).
- Average annual futures contract series return and speculative pressure have correlations 0.21, 0.80 and 0.24 for commodities, currencies and equity indexes but -0.84 for interest rates/fixed income.
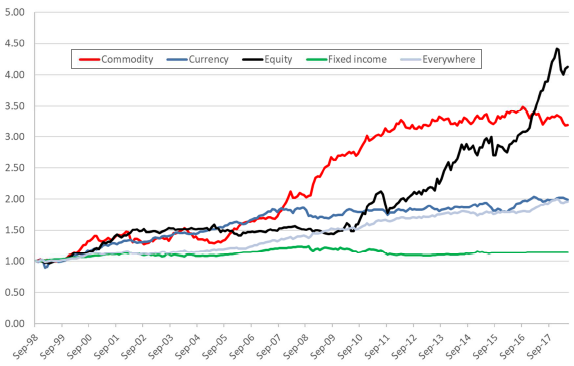
- The speculative pressure strategy generates Sharpe ratios comparable to those of momentum and carry in commodity, currency and equity index futures markets, but not interest rate/fixed income futures market. Specifically (see the chart below):
- Speculative pressure portfolios generate annualized average gross excess returns 4.1% for commodities, 2.5% for currencies and 4.0% for equity indexes, with respective annualized gross Sharpe ratios 0.61, 0.47 and 0.50. Both long and short side contribute to gross profitability.
- In contrast, the interest rate/fixed income speculative pressure portfolio generates annualized average gross excess return -0.7% and annualized gross Sharpe ratio -0.28.
- An overall speculative pressure portfolio with mean-variance optimized asset class contributions generates annualized average gross excess return 1.7% and annualized gross Sharpe ratio 0.55 (over a shorter sample period due to the optimization method).
- Speculative pressure portfolio turnovers are small compared to those for momentum, value and carry, such that trading frictions are more manageable.
- Cross-sectional tests indicate that speculative pressure offers information beyond that of momentum, carry and other risk premiums.
- Findings are robust to reasonable trading frictions, liquidity concerns, alternate definitions of speculative pressure, alternate portfolio constructions and various subsamples.
The following chart, taken from the paper, compares gross cumulative values of $1 initial investments in the four speculative pressure portfolios by class and the combined optimized (Everywhere) portfolio during October 1998 (when Everywhere is first available) through May 2018. Performance derives from total returns (excess returns plus the yield on 1-month U.S. Treasury bills). The strategy performs relatively well for commodities, currencies and equity indexes but poorly for fixed income. The plot highlights weak correlations among asset class portfolios, such that Everywhere offers low volatility and stable total returns. However, it also shows that asset class returns are episodic.

In summary, evidence indicates that traders may be able to exploit net positions of speculators from COT reports to time commodity, currency and equity index futures contract series.
Cautions regarding findings include:
- As noted with the chart above, speculative pressure strategies for specific asset classes exhibit deliver episodic success, such that there are multi-year subperiods of unprofitability.
- Efficient execution of the tested strategy is beyond the reach of some investors, who would bear fees for delegating to a managed futures fund.
For related research, browse results of this search.