How much does accounting for equity factor portfolio maintenance frictions affect usefulness of factor models of stock returns. In their March 2021 paper entitled “Model Selection with Transaction Costs”, Andrew Detzel, Robert Novy-Marx and Mihail Velikov examine effects of transaction costs on six leading models of stock returns:
- FF5 – Fama-French 5-factor model (market, size, book-to-market , investment and accruals-based profitability, reformed annually).
- FF6 – FF5 plus a momentum factor.
- HXZ4 – Hou, Xue, and Zhang 4-factor model (market, size, investment and profitability, all reformed monthly).
- BS6 – Barillas-Shanken 6-factor model (market, size, book-to-market reformed monthly, investment, return on equity and momentum).
- FF5C – FF5 with a cash flow-based profitability factor.
- FF6C – FF6 with a cash flow-based profitability factor.
They compare model effectiveness based on maximum squared Sharpe ratio (SR2), which measures how closely a model approaches the in-sample efficient frontier for all test assets. They measure transaction costs using stock-level effective bid-ask spread. Using data to calculate all factors employed by the six models and effective spreads during January 1972 through December 2017, they find that:
- Ignoring transaction costs, HZX4 and BS6 models have high SR2s, the former nearly 60% higher than SR2 for FF5.
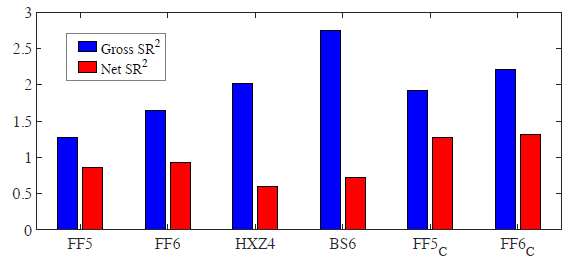
- However, accounting for transaction costs (see the chart below):
- HZX4 SR2 is nearly 40% lower than FF5 SR2.
- SR2s of the FF5C and FF6C (with cash flow-based profitability factor) are highest.
- In general, effectiveness differences between gross and net versions of a model derive from:
- Portfolio turnovers for the factors they use. Higher (lower) turnover, as for monthly (annual) portfolio reformation, results in greater (lesser) model degradation when incorporating costs.
- Degree of tilting toward small stocks, which tend to have higher effective bid-ask spreads than large stocks.
The following chart, taken from the paper, compares gross and net effectiveness (SR2) of the six factor models specified above over the full sample period. On a gross basis, the BS6 model is the clear winner. However, on a net basis FF5C and FF6C are the clear winners, while BS6 and HZX4 are worst.

In summary, evidence indicates that ignoring transaction costs when seeking the best combination of factors for stock selection results in selecting the wrong model.
Cautions regarding findings include:
- There are uncertainties in estimating transaction costs. The method used is complex and does not account for price impact of large trades, broker fees or shorting costs. These costs would further degrade effectiveness of all factor models and may vary by model similarly to effective spread.
- Exploiting factor models is beyond the reach of most investors, who would bear fees for delegating the work to a fund manager.
- Testing many models on the same data introduces data snooping bias, overstating effectiveness of the best-performing models.
See also “Emptying the Equity Factor Zoo?”.