Is it better to build equity multifactor portfolios by holding distinct single-factor sub-portfolios, or by picking only stocks that satisfy multiple factor criteria? In their September 2017 paper entitled “Smart Beta Multi-Factor Construction Methodology: Mixing vs. Integrating”, Tzee-man Chow, Feifei Li and Yoseop Shim compare long-only multifactor portfolios constructed in two ways:
- Integrated – each quarter, pick the 20% of stocks with the highest average standardized factor scores and weight by market capitalization.
- Mixed – each quarter, hold an equal-weighted combination of single-factor portfolios, each comprised of the capitalization-weighted 20% of stocks with the highest expected returns for that factor.
They consider five factors: value (book-to-market ratio), momentum (return from 12 months ago to one month ago), operating profitability, investment (asset growth) and low-beta. They reform factor portfolios annually for all except momentum and low-beta, which they reform quarterly. Using firm data required for factor calculations and associated stock returns for a broad sample of U.S. stocks during June 1968 through December 2016, they find that:
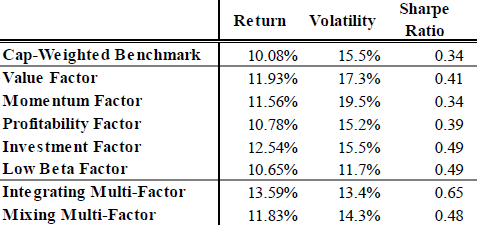
- On a gross basis, the integrated approach outperforms both the capitalization-weighted market and the mixed approach (see the table below).
- The market average gross annual return is 10.2%, with annual volatility 15.5% and gross annual Sharpe ratio 0.34.
- The integrated (mixed) portfolio has average annual gross return 13.6% (11.8%), annual volatility 13.4% (14.3%) and gross annual Sharpe ratio 0.65 (0.48).
- However, the integrated portfolio:
- Is generally less than one-third as diversified as the mixed portfolio in terms of number of holdings, resulting in relatively high idiosyncratic risk (tracking error relative to the market).
- Has average annual turnover 135%, more than twice the 68% of the mixed portfolio, thereby substantially reducing its gross outperformance.
- Also, the mixed approach is easier to understand and decompose into factor performance contributions.
- Equal weighting of stocks in integrated and mixed portfolios amplifies costs of turnover, eliminating the advantage of the former.
The following table, extracted from the paper, summarizes average gross annual returns, annual volatilities and gross annual Sharpe ratios of the capitalization-weighted benchmark, individual factor portfolios, the integrated multifactor portfolio and the mixed multifactor portfolio over the full sample period. On a gross return basis, all factor and multifactor portfolios beat the market. The integrated portfolio easily leads based on gross return and gross Sharpe ratio.

In summary, evidence indicates that integrating equity factors works better than mixing them on a gross basis, but outperformance of integration shrinks or disappears after accounting for its higher portfolio turnover.
Cautions regarding findings include:
- As noted in the paper, performance results are gross, not net.
- In general, multifactor approaches are beyond the reach of individuals, who would bear expenses/fees for accessing them via funds.
See also “Integrating Momentum and Value Stock Exposures” for a similar analysis involving only two factors.