Do both the long and short sides of portfolios used to quantify widely accepted equity factors benefit investors? In their November 2019 paper entitled “When Equity Factors Drop Their Shorts”, David Blitz, Guido Baltussen and Pim van Vliet decompose and analyze gross performances of long and short sides of U.S. value, momentum, profitability, investment and low-volatility equity factor portfolios. The employ 2×3 portfolios, segmenting first by market capitalization into halves and then by selected factor variables into thirds. The extreme third with the higher (lower) expected return constitutes the long (short) side of a factor portfolio. When looking at just the long (short) side of factor portfolios, they hedge market beta via a short (long) position in liquid derivatives on a broad market index. Using monthly returns for the specified 2×3 portfolios during July 1963 through December 2018, they find that:
- In general, long sides of the five factors outperform respective short legs. Specifically:
- Gross annualized Sharpe ratios for individual factor long-short portfolios range from 0.40 to 0.58.
- Gross annualized Sharpe ratios for individual long (short) sides range from 0.40 to 0.61 (0.37 to 0.54), with three of five long sides higher than respective short sides.
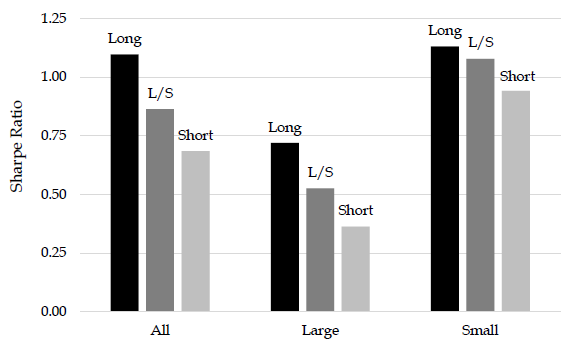
- For equally weighted, monthly rebalanced long-short, long side only and short side only combinations of the five factors (see the chart below):
- Gross annualized Sharpe ratios are 0.86, 1.10 and 0.69, respectively, indicating that long sides diversify across factors (close to zero return correlations) much more effectively than short sides.
- Maximum drawdowns are -24%, -10% and -16%, respectively.
- Gross Sortino ratios are 1.39, 1.88 and 1.07, respectively.
- Short side returns typically exhibit zero or negative alpha after controlling for respective long side returns. In contrast, long sides generally have significantly positive alpha after controlling for respective short sides. In other words, factor premiums generally come from long sides.
- Results hold across large and small market capitalizations, are robust over time, extend to international equity markets (except Japan) and are not attributable to tail risk differences.
- The idea that profitability and investment factors can replace value and low-volatility factors breaks down for long side only portfolios.
- Results are likely stronger for net returns than gross returns due to impacts of shorting costs and infeasibility of shorting some stocks.
The following chart, taken from the paper summarizes gross annualized Sharpe ratios of equally weighted, monthly rebalanced long-short, long side only and short side only combinations of the five factors specified above, with the latter two hedged against the broad stock market. It includes separate results for stocks in the larger and smaller halves of market capitalizations. Long sides outperform short sides overall and for both large and small stocks, with the difference more pronounced for large stocks.

In summary, evidence indicates that long sides of factor portfolios plus a market hedge from liquid derivatives is an efficient approach to equity factor investing.
Cautions regarding findings include:
- As noted, returns are gross, not net. Accounting for portfolio implementation frictions would reduce all returns, and frictions are higher for short sides than long sides.
- Tested strategies are beyond the reach of most investors, who would bear fees for delegating to a fund manager.