Is following the lead of certain types of equity investors as effective as using widely accepted factor models of stock returns? In their March 2021 paper entitled “What Do the Portfolios of Individual Investors Reveal About the Cross-Section of Equity Returns?”, Sebastien Betermier, Laurent Calvet, Samuli Knüpfer and Jens Kvaerner construct a factor model of stocks returns based on demographics of the individual investors who own them. They construct investor factors by each year reforming portfolios that are long (short) the 30% of stocks with the highest (lowest) expected returns based on holdings-weighted investor demographics and then measuring returns of these hedge portfolios the following year. They compare these investor factors to conventional factors constructed from firm/stock characteristics. Using anonymized demographics and direct stock holdings of Norwegian investors (an average 365,000 per year), and associated firm/stock characteristics and returns (over 400 stocks listed on the Oslo Stock Exchange), during 1997 through 2018, they find that:
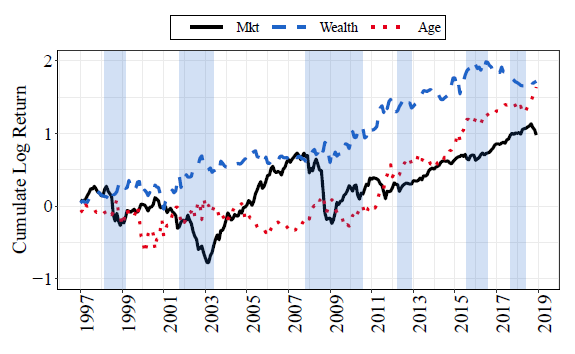
- Stocks held by older and wealthier investors outperform those held by younger and poorer investors (see the chart below). Specifically, over the full sample period:
- The age factor (based on age of owners weighted by the number of shares they own) generates monthly 1-factor (market) alpha 1.06%.
- The wealth factor (based on net worth of owners weighted by number of shares they own) generates monthly 1-factor alpha 0.98%.
- Both age and wealth factors have negative market betas.
- A 3-factor model of stock returns consisting of market, age and wealth factors effectively predicts the cross-section of stock returns. This model subsumes the predictive powers of conventional size, value, investment, profitability and momentum factors.
- Based on bootstrap simulations, a portfolio exploiting on the investor factor model has expected annualized gross Sharpe ratio 0.70 (compared with 0.32 for the Norwegian stock market and 0.70 for a 6-factor model portfolio encompassing market, size, value, investment, profitability and momentum). Annualized gross Sharpe ratio for a portfolio based on both investor and conventional factors is 0.84.
- Stocks held by older and wealthier (younger and poorer) investors tend to have relatively large market capitalizations, higher profitability, lower investment and lower betas (higher volatility, higher share turnover and lower institutional ownership).
The following chart, taken from the paper, tracks gross cumulative performances of age and the wealth factors as specified above (with cumulative market return for comparison) over the full sample period. Notable points are:
- The wealth factor is attractive compared to market performance, particularly in avoiding market crashes.
- The age factor is unimpressive during the first half of the sample period.
- There are extended subperiods when both the wealth and age factors underperform the market.

In summary, evidence indicates that stocks held by older (younger) and, especially, wealthier (poorer) equity investors tend to outperform (underperform) the market.
Cautions regarding findings include:
- Performance data are gross, not net. Accounting for periodic portfolio reformation costs and continuous shorting costs would reduce returns. Shorting may not always be feasible as specified.
- Obtaining stock ownership/owner data needed for exploitation of findings is problematic (and potentially costly). Even if data are available, the methodology used is beyond the reach of most investors, who would bear fees for delegating to a fund manager.
- Findings may not fully translate to other equity markets.